


INTRODUCTION
Value generation via economic efficiencies in healthcare systems is an increasingly important focal point in health care management, in a world where tied reimbursements and bundled payment models have emerged as leading compensation conduits for hospital and healthcare organization line items [1]. Orthopaedic surgeons have moved towards the adoption of a more value-based bundled payment model as health care organizations increasingly focus on value alignment [2]. Efficiencies may be realized within a health care “ecosystem” via both volume-driven cost benefits in addition to efficiency-driven patient care benefits.
Value in the context of healthcare is able to be defined as the ratio of the benefits provided by a healthcare service to the cost of rendering that service, incorporating both explicit and nonexplicit patient outcomes [3,4]. As providers and healthcare systems look to optimize value via improved patient outcomes, they bear in mind that higher surgeon and hospital volumes are correlated with greater value care delivery – whether via additional surgeon experience, standardized surgical procedure, or streamlined intra and postoperative processes [5-9]. High volume providers at both the surgeon and hospital level provide service with an associated decrease in cost known in business management as “economies of scale,” where systems with a larger production volume achieve lower costs and improved patient outcomes [10,11].
Spinal fusion surgery is a commonly performed procedure in the United States, with nearly 500,000 new cases annually nationwide and is one of the fastest growing surgical procedures in the past 2 decades [12]. Millions of cases are performed annually on a global basis [13]. Spinal fusion surgery can be an effective method for reduction of pain, increased stability, and correction of deformity. Given the increasing prevalence of the procedure, outcomes in spinal fusion can be more carefully evaluated using value-based analysis. The relationship between surgeon and hospital volume with patient outcomes has been increasingly examined in spinal fusion surgery [14-17]. To our knowledge, only 2 of these previous studies have made efforts to identify data-driven volume-based benchmarks for surgeons and hospitals for the performance of common lumbar spine surgical procedures based on risk of complications and readmissions [16,17]. That said, these previous studies only identified single thresholds wherein surgeons and hospitals could improve the value of spinal fusion surgery. At present, there remains a need for determining additional outcomes-based thresholds in order to stratify surgeons and hospitals into more than 2 categories and to ultimately realize a practically translatable volume-value relationship in spinal fusion surgery.
Stratum-specific likelihood ratio (SSLR) analysis is a promising method of establishing meaningful volume-based thresholds. This methodology was first described in 1993 by Peirce and Connell [18]. in the context of risk stratification for heart transplants. SSLR analysis uses a receiver operating characteristic (ROC) curve to identify specific volume thresholds which provide significant differences in a particular outcome. Recently, SSLR analysis has been resurrected and applied to orthopaedic procedures including total knee arthroplasty, shoulder arthroplasty, ACL reconstruction, adolescent idiopathic scoliosis, and total hip arthroplasty [19-24]. These studies have demonstrated that an increased annual procedural volume has been associated with reduced LOS and reduced cost at both the hospital and surgeon level. No study to date has applied SSLR analysis in order to determine data-driven thresholds in spinal fusion surgery.
The primary purpose of this study was to analyze the volumevalue relationship in spinal fusion surgical care with respect to both a patient outcome, length of stay (LOS), and an economic outcome, cost, to generate clinically meaningful, evidence-based volume thresholds. To accomplish this aim, we performed SSLR analysis using ROC curves to characterize the volume-LOS and volume-cost relationship in spinal fusion surgery, similar to analysis performed for other procedures, and determine (1) the surgeon volume thresholds predictive of decreased LOS and cost, and (2) the hospital volume thresholds predictive of decreased LOS and costs. Upon generating these thresholds, a secondary aim was to assess the relative market share of spinal fusion cases among these newly defined surgeon and hospital volume strata.
MATERIALS AND METHODS
The methodology for this study, including data sourcing, statistical and data analysis, was performed in accordance with previously published analyses for the relationship between volume and cost as well as volume and LOS first reported by Ramkumar et al. [20] for shoulder arthroplasty.
1. Data Sources and Study Population
Data was gathered exclusively from the New York State Department of Health’s Statewide Planning and Research Cooperative System (SPARCS) database, a comprehensive reporting system, which collects patient-level data on all discharges from nonfederal acute-care hospitals in the state of New York. The dataset used included patient-specific data from 2009 through 2015, as this date range encompassed the total patient-specific data available at the time.
We used Clinical Classification Software (CCS) and All Patient Refined Diagnosis Related Groups (APR-DRGs) codes to define spinal fusion surgery. The cohort met the following CCS procedure code inclusion criterion: CCS Procedure Code 158 – “Spinal Fusion.” This criterion was used to ensure that the most comprehensive cohort of spinal fusion candidates were incorporated. The analysis included 157,788 patients with surgery dates from January 1, 2009 through December 31, 2015. Analysis was derived from 870 hospitals and 4,368 surgeons within the state of New York.
We defined annual surgeon volume as the total number of spinal fusion surgeries performed in that calendar year, using the unique, coded Operating Surgeon identifier. Annual surgeon volume combines the comprehensive case volume for each surgeon that operates at more than one hospital in New York. Similarly, we defined annual hospital volume as the total number of spinal fusions that were performed within a given hospital in that calendar year, using the unique Hospital identifier. LOS was defined as the number of days during the patient’s operative admission.
2. Statistical Analysis
Two distinct ROC curves were generated: (1) surgeon volume vs. LOS; (2) hospital volume vs. LOS. SSLR analysis of these ROC curves was performed subsequently. The first step of SSLR analysis includes dividing the cohort into many different groupings and calculating a risk ratio for each group. These groups are then merged into increasingly larger groups until a significant difference in risk ratios is demonstrated between adjacent groups. This analysis generates discrete groups with statistical significance, providing an objective method of partitioning data sets into volume-based groupings.
For the purposes of our study, the SSLR value was defined as the ratio of sensitivity to 1-specificity. The sensitivity (true positive rate) and 1-specificity (false positive rate) were based off of the associated threshold LOS or cost cutoff established, allowing for determination where LOS was meaningful. The LOS cutoff used to generate the ROC curves was 6 days. The cost cutoff used to generate the ROC curves was $35,000. This cutoff was chosen after testing a series of cutoffs and identifying the cutoffs with the greatest area under the curve (AUC). A pvalue of <0.05 was used as the definition of statistical significance in order to allow for curve comparison and the establishment of statistically significant thresholds. Odds ratios and confidence intervals were calculated to allow for comparison of volume thresholds using a point estimate and the confidence coefficient and standard error. The highest volume grouping was used as the reference group for each respective analysis.
After generating the four aforementioned sets of volume strata, we examined the relative market share of spinal fusion repairs among the newly defined sets of surgeon and hospital volume strata. This was accomplished by comparing the percentage of total spinal fusion surgeries performed by each unique surgeon or hospital volume stratum. Thus, we went back into our original dataset and stratified each volume group by patient-level APR Severity of Illness and Risk of Mortality. Cutoffs for the volume groups were derived from the surgeon/hospital volume vs. LOS SSLR analyses. APR Severity of Illness and Risk of Mortality were the only variable available in the SPARCS database to approximate case complexity. For the purposes of cross-group comparison, “minor” was coded as 1, “moderate” as 2, “major” as 3, and “extreme” as 4. The purpose of this analysis was to examine the distribution of case complexity between higher and lower volume surgeons and hospitals. ROC curves were generated using SPSS ver. 22.0 (IBM, Armonk, NY, USA). SSLR and all other statistical analyses were performed using Microsoft Excel (Microsoft, Redmond, WA, USA).
RESULTS
1. Demographics
Of this cohort of 157,788 spinal fusion patients, the mean age for patients undergoing spinal fusion repair was 53.5±16.9 years. We calculated the mean age by weighting bucket (e.g., 50–69) means assuming a standard distribution within each bucket. The patient pool was more likely to be female (52.4%), over the age of 50 (62.7%), and White (73.3%). Medicare (27.7%), private insurance (22.3%), along with Blue Cross/Blue Cross and Blue Shield (17.6%) were the most common payer types. Full demographic data is included in Table 1. Surgeon volume ranged from 1 to 412 annual spinal fusions. Hospital volume ranged from 1 to 1,733 annual spinal fusions. Overall LOS in this cohort averaged 4.30 days/case. Mean cost in this cohort was $32,230.35/case.
2. Surgeon Threshold Analysis
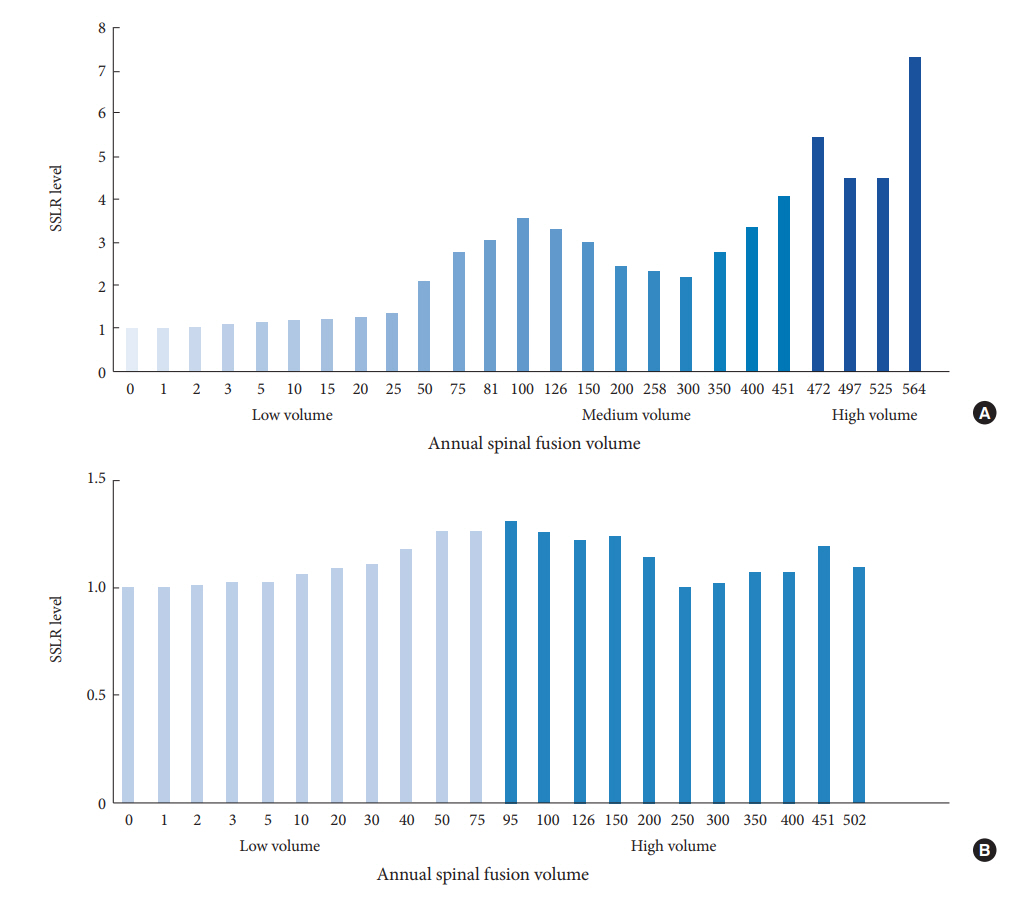
SSLR analysis of the ROC curve for LOS by annual surgeon volume identified the following strata: 0–57 (low volume), 58–90 (medium volume), 91–124 (high volume), and 125 or more (very high volume). The maximum determined AUC for LOS by annual surgeon volume was 0.63 based off of a ROC curve with a cutoff at 6 days. The volume thresholds at 58, 91, and 125 annual spinal fusion cases were each found to be statistically significant for decreased LOS (p=0.001, p=0.015, and p=0.004, respectively; odds ratio [OR]: 19.253, 8.718, and 4.365, respectively). LOS decreased in progressively higher volume groups: patients operated on by low-, medium-, high-, and very high volume surgeons had mean LOS of 6.28 days, 4.57 days, 4.02 days, and 3.62 days, respectively (42.4% decrease from low- to very high volume) (Table 2, Fig. 1A).
SSLR analysis for cost by annual surgeon volume failed to yield statistically significant ROC curves. The maximum determined AUC for cost by annual surgeon volume was 0.56 based off of a ROC curve with a cutoff at $35,000. The closest volumes approaching statistical significance for cost by annual surgeon volume identified the following strata at which costs savings were apparent: 0–43 (low volume), and 44 or more (high volume), with more than $4,200 in cost savings, on average (p=0.136; OR, 1.357) (Table 3, Fig. 1B).
3. Hospital Threshold Analysis
SSLR analysis of the ROC curve for LOS by annual hospital volume identified the following strata: 0–80 (low volume), 81–471 (medium volume), and 472 or more (high volume). The maximum determined AUC for LOS by annual hospital volume was 0.73 based off of a ROC curve with a cutoff at 6 days. The volume thresholds at 81 and 472 annual spinal fusion cases were each found to be statistically significant for decreased LOS (p=0.008 and p=0.016, respectively; OR, 10.548 and 2.090, respectively). LOS decreased in progressively higher volume groups: patients receiving care at low-, medium-, and high-volume centers had mean LOS of 6.10, 4.23, and 3.99 days, respectively (34.6% decrease from low- to high volume) (Table 4, Fig. 2A).
SSLR analysis for cost by annual hospital volume failed to yield statistically significant ROC curves. The maximum determined AUC for cost by annual hospital volume was 0.56 based off of a ROC curve with a cutoff at $35,000. The closest volumes approaching statistical significance for cost by annual hospital volume identified the following strata at which costs savings were apparent: 0–94 (low volume), and 95 or more (high volume), with more than $2,800 in cost savings, on average (p=0.846; OR, 1.602) (Table 5, Fig. 2B).
4. Market Share of Annual Spinal Fusion Caseload Among Surgeon and Hospital Volume Strata
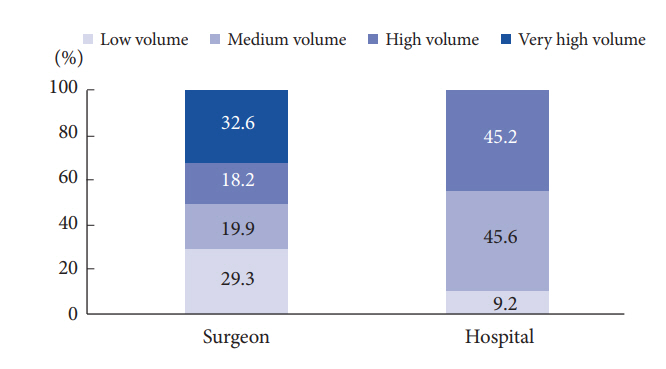
With respect to surgeon market share, very high-volume surgeons performed the largest proportion of spinal fusions (32.6%), followed by low-volume surgeons (29.3%). With respect to hospital market share, medium-volume centers saw the largest share of spinal fusion cases (45.6%), followed by high-volume centers (45.2%) (Fig. 3).
5. Distribution of Patient Comorbidities Among Surgeon and Hospital Volume Strata
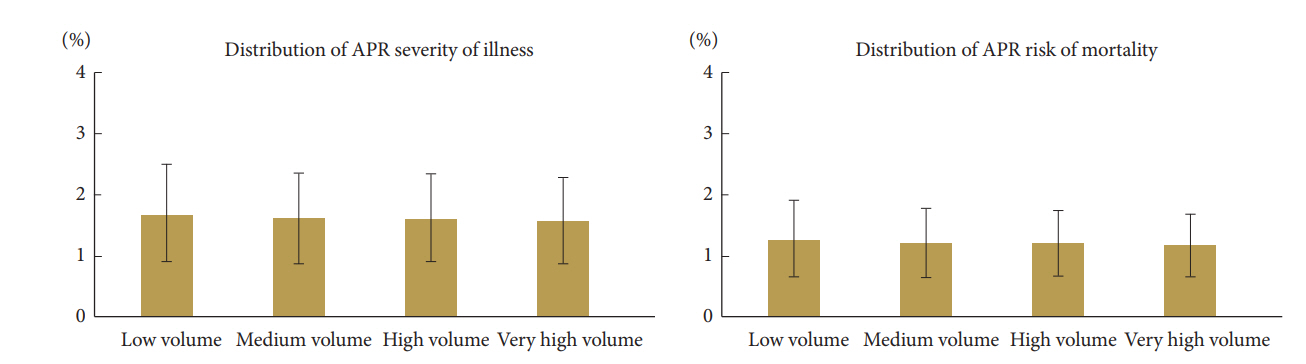
Overall, 52.8% of patients had an APR Severity of Illness of minor, 35.0% had moderate, and 12.2% had major or extreme. 84.5% of patients had an APR Risk of Mortality of minor risk, 11.0% had a moderate risk, and 4.5% had a major or extreme risk. APR severity of illness and risk of mortality scores did not vary significantly among surgeon or hospital volume strata (p>0.05) (Figs. 4, 5).
DISCUSSION
Efficiencies in terms of outcomes is of importance to hospitals and surgeons alike, and economies of scale in spinal fusion surgery provide significant outcome benefits to both patients and hospitals by value measures. Previous studies have demonstrated a volume-outcomes relationship in spinal fusion surgery exists, and this study found evidence-based thresholds for surgeons and hospitals that demonstrate a direct relationship between volume and LOS, thereby defining an annual procedural volume at which outcome gains are made in spinal fusion surgery. However, no relationship was found between procedural volume and cost for either surgeons or hospitals.
SSLR analysis of the ROC curve for volume vs. LOS yielded notable results. The surgeon analysis revealed that surgeons performing spinal fusion could be grouped into 4 volume categories based on annual surgical volume: 0–57 (low volume), 58–90 (medium volume), 91–124 (high volume), and 125 or more. The mean LOS for patients decreased in progressively higher volume strata, demonstrating a direct relationship between volume and improved outcomes in the context of spinal fusion care. The patients of low-volume surgeons spent over two and a half days longer in the hospital–on average–compared to the patients of very high-volume surgeons (6.28 days vs. 3.62 days). The reduction in LOS from the high to medium volume level was modest, but may still represent a potential clinical optimization opportunity at the administrative level. Based on these results, it appears that there may be critical thresholds around 60, 90, and 125 annual cases wherein surgeons can improve the quality of care they are providing their patients through decreased LOS. These findings suggest that surgeons may benefit from performing a greater annual caseload to overcome a substantial (~60 annual cases) “learning curve” in spinal fusion surgery. Additionally, these findings suggest that patients may benefit substantially from selective referral to higher volume spine surgeons. Schoenfeld’s group (2017) used spline analysis of patients from the Florida Inpatient Dataset to identify single benchmarks for anterior and posterior cervical fusion at 40 and 30 annual cases, respectively, wherein surgeons saw decreased complications and risk of readmission for their patients [16]. Schoenfeld et al. [17] used this same approach to identify benchmarks for lumbar interbody fusion and lumbar posterolateral fusion at 43 and 35 annual cases, respectively, wherein surgeons saw decreased complications and risk of readmission for their patients. Our findings add to these studies by identifying additional thresholds above these initial benchmarks for spinal fusion surgery. Our study suggests that rather than stagnating after reaching a particular benchmark, surgeons can continue to achieve substantial improvements in quality of care by reaching higher annual thresholds. The aforementioned volume thresholds were used to compare the relative market share of spinal fusion cases among surgeon volume strata. This analysis revealed that very high-volume surgeons performed the largest proportion of spinal fusion cases (32.6%). Very high- and high-volume surgeons combined performed the majority (50.8%) of spinal fusion cases, evidencing the efficiency of consolidated care-based systems.
On the other hand, SSLR analysis of the ROC curve for surgeon volume vs. cost failed to produce statistically significant volume strata despite indicating cost savings with higher volume. This may be seen from the determined maximum AUC for LOS being higher at the hospital level, with the resulting maximum AUC for surgeon specific LOS lower by 0.10 as was for cost at both the hospital and surgeon level at 0.17 lower respectively. The closest threshold along the ROC curve was at 44 annual cases, yielding strata at: 0–43 (low volume), and 44 or more (high volume). The average total costs for these strata were $35,641.08 and $31,359.95 for low- and high-volume surgeons, respectively. While the cost difference of $4,281.13 between these 2 strata may appear to be clinically meaningful, it is important to consider that LOS can be a confounding factor leading to increased hospital costs. Previous studies have described an approximate $2,175 cost for each day in a New York hospital, and therefore the savings patients operated on by highvolume surgeons see may be a product of decreased hospital LOS more so than surgeon experience [25].
The hospital analysis revealed that hospitals handling spinal fusion could be divided into three categories based on annual surgical volume: 0–80 (low volume), 81–471 (medium volume), and 472 or more (high volume). These results suggest that there may critical thresholds around 80 and 470 annual cases wherein hospitals can logistically and structurally optimize the quality of spinal fusion care. Similar to the trend described in the surgeon analysis, mean LOS for patients decreased in progressively higher hospital volume strata. Patients presenting to low-volume centers spent over 2 days longer in the hospital–on average–than patients presenting to high-volume centers (6.10 days vs. 3.99 days). Increased LOS may often result in increased costs for both the patient and hospital, as well as increased risk of hospital acquired infection for the patient [26,27]. Taken together, these findings suggest that patients and hospitals alike would benefit from the consolidation of spinal fusion surgery to higher volume, specialty centers. The aforementioned studies by Schoenfeld’s group identified a single volume benchmark for hospitals at 120 annual cases for anterior and posterior cervical fusion [16]. This benchmark is substantially below the threshold we identified at 472 annual cases, and more in line with our threshold for medium-volume centers. In this way, our study adds to the volume-value discussion by identifying additional thresholds above the existing benchmarks wherein hospitals can realize economies of scale and deliver more efficient, higher quality care to their patients. One possible explanation for this discrepancy is that Schoenfeld’s group used the Florida Inpatient Dataset, which may have a different patient population composition than those in New York State, where some hospital annual spinal fusion volumes exceed 1,000. With respect to the relative market share of spinal fusion cases among hospital volume strata, our analysis revealed that high-volume centers are not handling the majority of spinal fusion cases, outpaced marginally by medium-volume centers. It is worth noting that the medium-volume stratum included 333 hospitals, compared to only 100 included in the high-volume stratum. A more promising finding, however, was that low-volume centers only handle 9.2% of spinal fusion surgeries, suggesting the existence of hospital-based economies of scale optimization in spinal fusion surgery. Nevertheless, these findings highlight a potential area for improvement in the delivery of high quality spinal fusion care in terms of increasing referral and access to high-volume spine centers. In the analysis of cost at the hospital volume level, we were unable to generate meaningful statistically significant thresholds, suggesting that additional variables contribute to the cost of spinal fusion surgery. This finding is unique compared to analysis of other orthopaedic surgical modalities demonstrating efficiency in cost with increased volume with statistically significant thresholds. However, our analysis suggests that a delineation between high and low volume centers resulting in cost savings does exist.
Why does a significant threshold for cost not exist? It may be attributed to the fact that hospitals are using different implants with varying overhead costs, which could not be accounted for with the studied database. It could also be that the complexity of higher volume cases is greater and thus requires additional resources. Utilizing a novel operative complexity index across 141,357 patients, Paul et al. [28] performed a retrospective analysis that showed high volume centers performed more complex cases moderately associated with increased total cost. Lastly, value may be derived is ultimately from reduced LOS rather than true cost per time savings. Additional investigation is necessary to determine the nature of the fixed relationship between the volume of care and the cost efficiency that the hospital provides with respect to spinal fusion surgery. Potential drivers resulting in a fixed cost relationship may include the relative dynamic nature of implant prices used by hospital and surgeons in spinal fusion surgery and the variable nature in recording how many levels were fused during spinal fusion surgery – a result of a poor administrative database. That said, the price of implants and surgery may be more fixed in spite of a variable number of levels incorporated. This could mean that value based care based on cost outputs may not be attainable or that additional variables are needed to be incorporated to understand the nature of this relationship.
With SSLR now available as a macroeconomic assessment tool of the procedural milieu in orthopedic surgery to examine value-volume relationships, we are able to expand the focus of operational efficiencies. This study has ascertained that in spinal fusion surgery there is both a direct relationship between volume and LOS, a variable value volume model, and there is likely a fixed relationship between volume and cost. The present study has limitations that should be noted. The study's findings were derived from the SPARCS administrative database, a statewide database offering limited case-specific information. This limitation prevented us from answering the question of whether or not high-volume surgeons and hospitals handle more complex cases than their low-volume counterparts in much detail. Furthermore, interpretation of exact thresholds is dependent upon the database, set of case, and outcome metric leveraged. Longer-term outcomes and a comprehensive nationwide database will allow for further delineation of established thresholds. Thus, the current thresholds established from this study represent a benchmark for the value-volume relationship in spinal fusion surgery. Additional analysis of a more comprehensive database adjusted for patient comorbidities may allow for more definitive thresholds to be established. Furthermore, we propose that a single, holistic value-based index for spinal fusion surgical care be created based on a comprehensive national database set.
Improving value of care in orthopaedic surgery is a pertinent endeavor given the significant extrinsic variability in costs of care including expensive implants and variability of healthcare teams charged with the care of a single patient. This study provides guidelines for a potential internal mechanism of improving value of spinal fusion care, wherein surgeons and hospitals can improve patient outcomes via increased surgical volume. Based on the findings of our study, there exists a statistically significant improvement in higher volume surgeons and hospitals compared to those who perform a lower volume from a value-based perspective, although various other clinical parameters remain to be examined to elucidate further. Additional investigation is required to determine if the increased value associated with higher volume surgeons and hospitals can be attributed to economies of scale or the training and experience of the surgeon. In this vein, further research which key factors drive costs and whether higher volume surgeons and hospitals combined with increased organizational and structural efficiency as well as greater bargaining power for implants are able to provide better patient outcomes at reduced costs to hospitals.
CONCLUSION
This study identified evidence-based thresholds for spinal fusion surgery wherein both surgeons and hospitals saw practical improvement in value of care as part of a variable model, whereas cost remained part of a fixed model. Very high- and highvolume surgeons perform the majority of spinal fusion cases; however, the largest proportion of these cases are handled by medium-volume centers. These findings highlight the role of consolidation and optimization to date in spinal fusion procedures, as well as a potential area for improvement in terms of further consolidation towards higher volume specialty spine centers. Further research will focus on identifying the financial factors that may modify the volume-value relationship in spinal fusion care.