


INTRODUCTION
The paraspinal muscles, as important structures for strengthening the stability of the spine and maintaining spinal balance, are inevitably affected during spinal degeneration, as evidenced by atrophy of muscle fibers (particularly in type 2 fast-twitch fibers) and increased fat infiltration (FI) [1]. Some studies have shown that FI is a good indicator of the degree of muscle degeneration [2-4]. FI in paraspinal muscles is assessed quantitatively by measuring the percentage of fat in the cross-sectional area (CSA) of the muscle [5,6].
In general, FI of the paraspinal muscles shows a tendency to progress from the lumbosacral region to the thoracolumbar region, with the paraspinal muscles, such as the multifidus muscle and erector spinae, being the most severely affected muscles in the early stage, while other muscles, such as psoas major muscle (PMM), may also be affected [1,7]. Previous studies have demonstrated that age and gender are significant factors in FI, women and elders usually accompany higher FI in paraspinal muscle [8,9]. Furthermore, degeneration of the intervertebral disc has been found as an independent risk factor for FI of the paravertebral muscle [10]. In recent years, spinopelvic parameters have been found to influence the paraspinal muscles in patients with degenerative spinal diseases. In adult spinal deformity patients, higher FI was associated with increased pelvic incidence (PI) minus lumbar lordosis (LL) and pelvic retroversion [11]. Muscle strength and CSA of the erector spinae were negatively correlated with pelvic tilt (PT) in patients with lumbar degeneration [12]. In addition, studies have found differences in spinal pelvic parameters in patients with different lumbar degenerative diseases [13,14] such as higher PI, sacral slope (SS), and PT in patients with lumbar spondylolisthesis compared to patients with lumbar spinal stenosis. Therefore, the effect of spinal pelvic morphology on fatty infiltration of lumbar paraspinal muscles deserves further investigation, especially in patients with degenerative lumbar spondylolisthesis (DLS).
We hypothesized that patients with DLS have different FI of the paraspinal muscles under different spinopelvic parameters. The objective of this study is to identify the effect of pelvic morphology on paraspinal muscle FI in patients with DLS.
MATERIALS AND METHODS
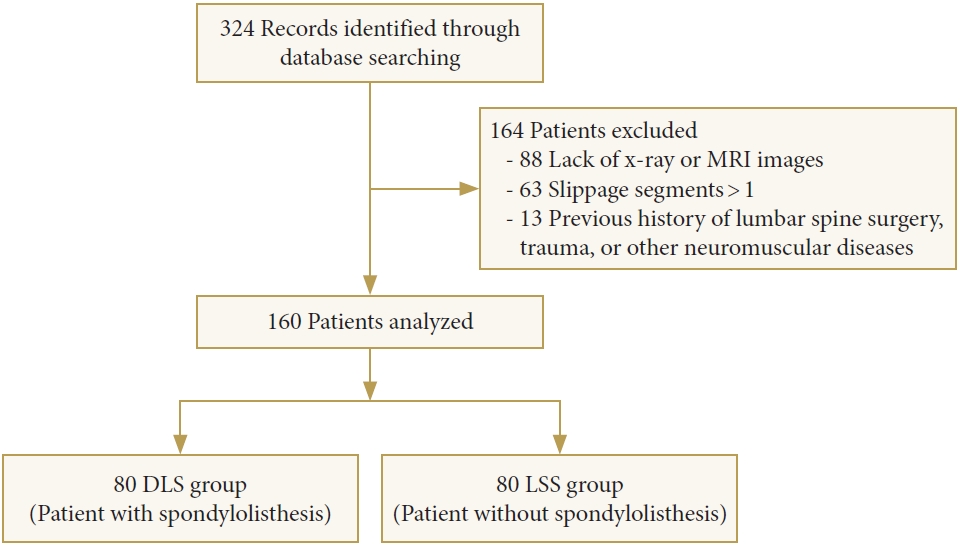
A retrospective study of 324 patients diagnosed with degenerative lumbar stenosis in a single-center database from January 2019 to December 2021 was conducted. Sex, age, body mass index (BMI), visual analogue scale (VAS) score, symptom duration, operation time, blood loss, and other medical record data were collected. All patients underwent standard lateral full-spine x-ray and lumbar magnetic resonance imaging (MRI) tests. Patients with a history of spinal trauma, surgery, inflammatory arthritis, tumors, neuromuscular disease, or multisegment spondylolisthesis were excluded. Eighty patients with DLS were collected as the DLS group, and 80 patients with lumbar spinal stenosis but without spondylolisthesis as the lumbar stenosis (LSS) group (Fig. 1). This study was approved by the ethics committee of the host institution, Nanfang Hospital (NFEC-2022-482).
Lateral full-spine radiographs of the patient in the standing position were obtained using an AXIOM Aristos VX X-ray unit (Siemens, Germany). The PI, SS, PT, LL, sagittal vertical axis, and the Barrey ratio (BR) were measured on radiographs using previously reported method [15,16]. Besides, the Meyerding grading system was used to score the extent of spondylolisthesis. All patients were distributed into the pelvic anteversion group (PT<5°), normal pelvic group (5° < PT < 25°), and pelvic retroversion group (PT> 25°) [17]. In addition, patients were also distributed to subgroups by different PI, SS, or BR according to the Roussouly classification [18,19]. The difference in FI of paraspinal muscle (PSM) and PMM was compared among different subgroups, respectively.
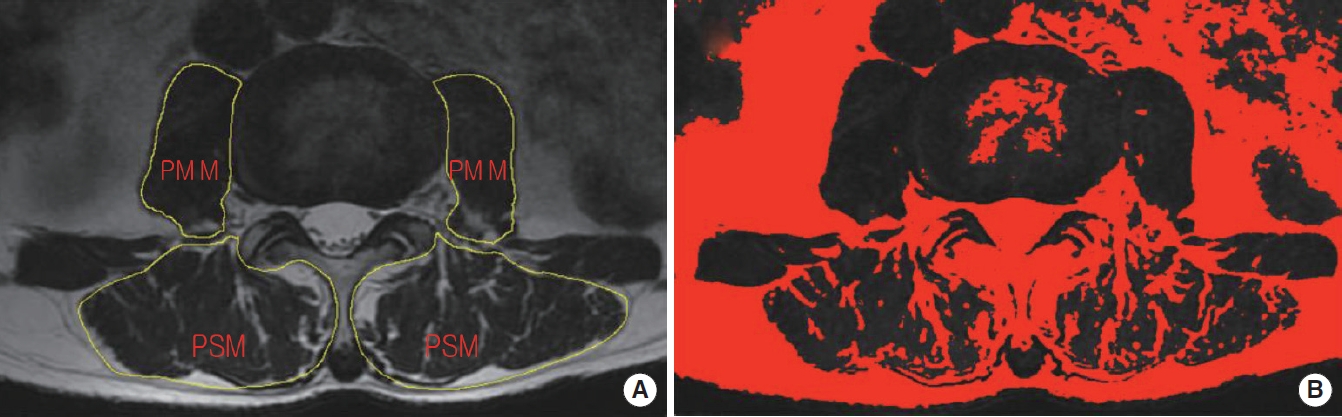
The bilateral CSAs of the paraspinal muscle (including the multifidus and erector spinae muscles) and psoas muscle were manually measured on T2-weighted axial MRI images at the level of each disc from L1 to S1 [9,20]. Meanwhile, disc degeneration and canal stenosis were evaluated using the Pfirrmann grading system and the Schizas grading system on the T2-weighted sagittal MRI images. To calculate the FI area, all the images were converted into 8-bit binary images so that fat (high signal area) can be distinguished from muscle (low signal area) by different grayscale ranges using a threshold technique (Fig. 2). The FI of PSM and PMM was calculated as ratios of fat area to total muscle area.
All measurements were independently assessed by 2 trained investigators, and the investigator performing the MRI measurements was blinded to the subgroup. In addition, another trained surgeon performed the measurement on a randomized group of 20 patients to assess interrater reliability.
All values were presented as mean ± standard deviation and analyzed using IBM SPSS Statistics ver. 26.0 (IBM Co., Armonk, NY, USA). The intraclass correlation coefficient (ICC) was calculated to evaluate the interrater reliability of spinopelvic parameters, Pfirrmann grade, and FI between the 2 investigators. Spearman correlation tests were performed to analyze the correlations between the FI and the demographic and sagittal spinopelvic parameters. Two-way analysis of variance and Kruskal-Wallis test were also performed to identify the difference between patients with different diseases and spinopelvic parameters. p-values less than 0.05 were considered as significant differences.
RESULTS
The DLS group consisted of 38 males and 42 females, aged 56.1 ± 13.3 years, with a BMI of 24.6 ± 3.3 kg/m2, and the LSS group consisted of 41 males and 39 females, aged 55.7 ±12.8 years, with a BMI of 24.2 ± 4.0 kg/m2 (Table 1). In addition, the differences in PT, PI, SS, and LL between the DLS and LSS groups were all significant.
The FI of PSM and PMM in the DLS group was 0.43 ±0.15 and 0.11 ± 0.08, respectively, while in the LSS group, it was 0.40 ± 0.15 and 0.09 ± 0.07, respectively, and the difference in FI between the 2 groups was significant. Subgroup analysis showed that the PSM FI of female patients (DLS group: 0.49 ± 0.13, LSS group: 0.44 ± 0.13) were significantly higher than those of male patients (DLS group: 0.36 ± 0.13, LSS group: 0.36 ± 0.15). Similar differences in the PMM FI between genders were also observed but with lesser magnitude.
The FI of PSM was positively correlated with age (r = 0.401, r = 0.518), Pfirrmann disc grade (r = 0.365, r = 0.468), symptom duration (r=0.151, r=0.244), operation time (r=0.155, r=0.121), and blood loss (r = 0.198, r = 0.141) in both the DLS and LSS groups, In contrast, the FI of PMM was only relatively weakly correlated with age (r = 0.132, r = 0.261) and BMI (r = -0.130, r = -0.126). the FI of PSM was also correlated with the Meyerding grade (r = 0.232), while no significant correlation was observed between FI and the Schizas grade and VAS score. In the DLS group, FI of PSM was significantly correlated with PT, PI, SS, LL, and BR (r = 0.361, r = 0.443, r = 0.192, r = 0.194, and r = 0.102, respectively), whereas FI of PSM in the LSS group was only negatively correlated with BR (r = -0.144). In addition, there was no significant correlation between the PMM FI and spinopelvic parameters in the DLS or LSS groups.
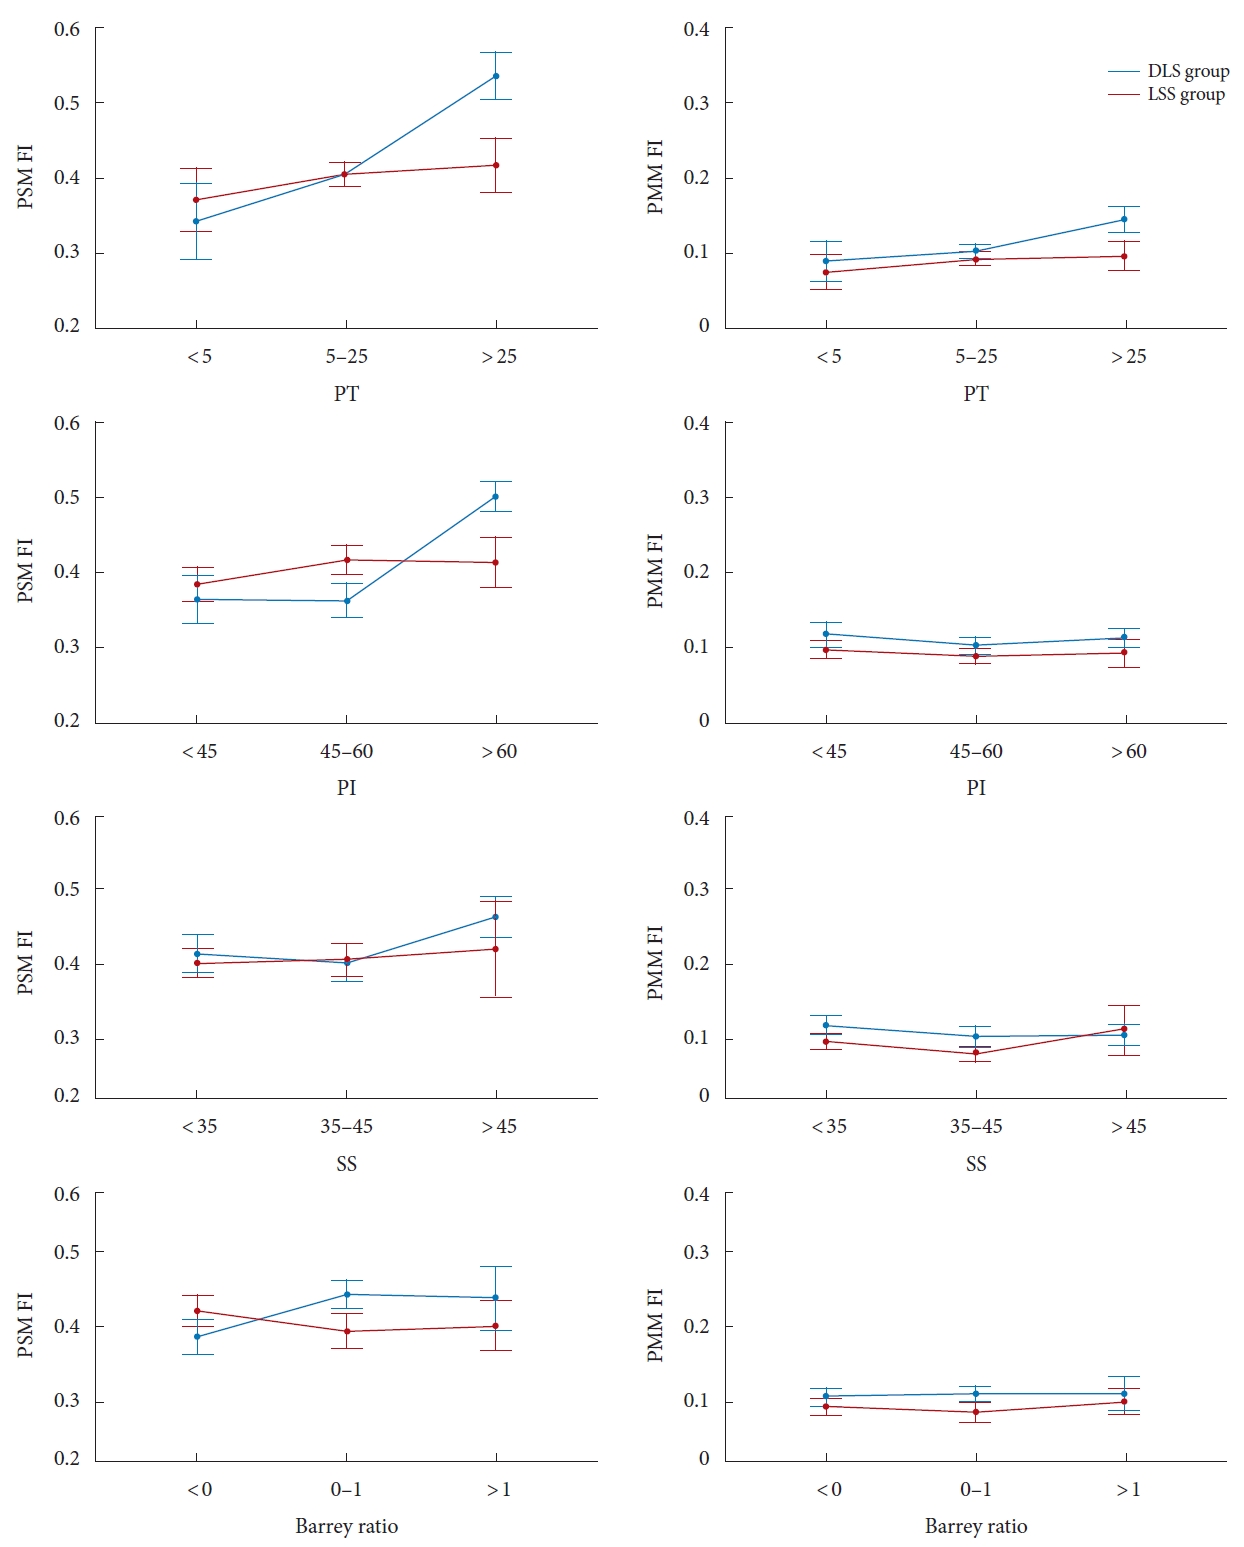
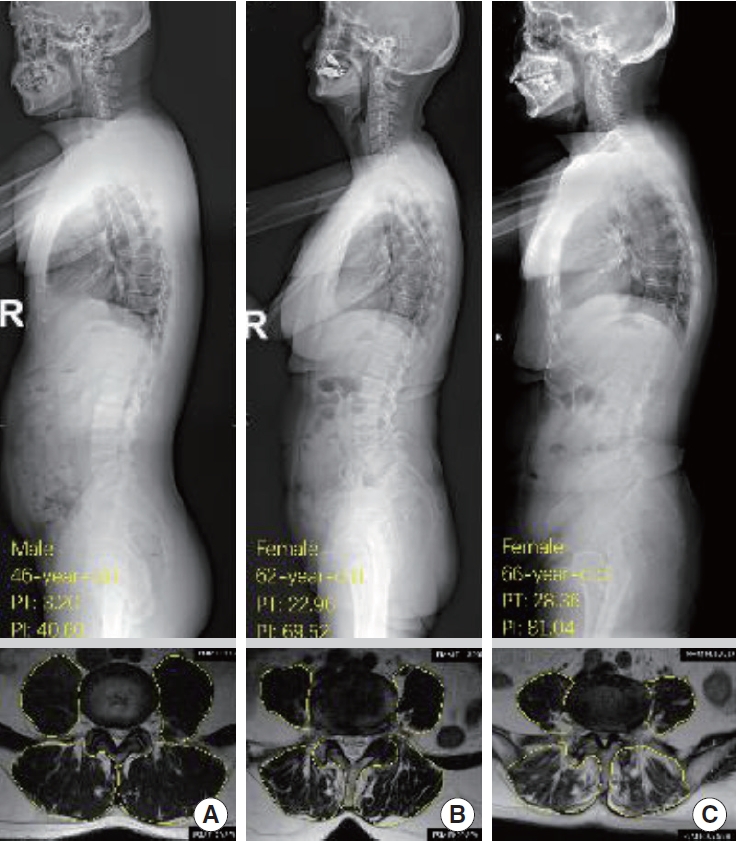
Fig. 3 illustrates the PSM FI between patients with different spinopelvic parameters in the DLS and LSS groups. In this study, there were 15, 118, and 27 patients in the anteversion, normal pelvic, and retroversion groups, respectively. In the DLS patients, the FI of PSM was significantly higher in the retroversion group (0.54 ± 0.13) than in the normal pelvic group (0.41 ±0.14) and the anteversion group (0.34 ± 0.12), and the difference between groups was significant (Table 2). In contrast, there was no significant difference in the PSM FI between these 3 groups in the LSS group. Three typical cases with different PT were presented with their x-ray and MRI images (Fig. 4).
Similarly, there were 45, 66, and 49 patients with small, normal, and large PIs. In patients with DLS, the PSM FI with large PI was significantly higher than that with small PI and normal PI, whereas in patients with LSS, the difference in FI between PI subgroups was not significant (Table 2). Besides, the PSM FI showed a similar trend on the subgroup of SS as it did on the subgroup of PI, the PSM FI in patients with large SS (SS> 45°) was higher than that of other SS groups in the DLS group but not in the LSS group. In addition, patients with pelvic retroversion or SS> 45° are more common in the high PI (PI> 60°) population, particularly in the DLS patients (Table 3). However, no difference was found in the PSM FI between patients with different BRs. For PMM, there were no significant differences in FI between subgroups of PT, PI, SS or BRs in patients with DLS or LSS.
There was excellent interrater reliability between the 2 researchers on all measured parameters in this study. The ICC was 0.93 for SS (p < 0.01; 95% confidence interval [CI], 0.82–0.97), 0.97 for PI (p < 0.01; 95% CI, 0.93–0.99), and 0.95 for Pfirrmann grade (p < 0.01; 95% CI, 0.93–0.96). The ICC was 0.94 for PSM FI (p < 0.01; 95% CI, 0.86–0.98), and 0.93 for PMM FI (p < 0.01; 95% CI, 0.81–0.97).
DISCUSSION
Previous studies illustrated the relationship between FI in paraspinal muscles and age, sex, and Pfirrmann grade, i.e., the paraspinal muscle FI was positively correlated with the degree of intervertebral disc degeneration and age [1,21]. Our study keeps in agreement with previous studies that FI of PSM in patients with degenerative lumbar spine increased with age and disc degeneration. However, this correlation does not shed light on the mechanisms of FI. From a spine perspective, aging is an event of kyphosis that leads, in particular, to a decrease in LL and retroversion of the pelvis [19], aggravating the FI of paraspinal muscles. From a biomechanical view, the posterior muscles act like the steel cables of a crane to maintain the balance of the spine, so changes in the overall morphology of the spine and pelvis have a greater impact on the paraspinal muscles. However, few studies have been reported on the effect of spinopelvic parameters on FI of the paraspinal muscles.
The association between FI and spinopelvic parameters in different populations is still controversial in previous studies. Some studies concluded that there were correlations between global sagittal malalignment and FI of paraspinal muscles in patients with lumbar degenerative disease [11,12,22]. However, these correlations were not significant in asymptomatic populations [23]. To the best of our knowledge, this study is the first to separately analyze the associations between spinopelvic parameters and FI of paraspinal muscles in patients of lumbar spondylolisthesis and lumbar spinal stenosis.
The present study confirmed that fatty infiltration of the paraspinal muscles increased with greater pelvic retroversion or larger pelvic incidence angle in patients with lumbar spondylolisthesis, whereas no such trend in patients with lumbar spinal stenosis. Specifically, FI of PSM was positively correlated with PT, SS, PI, and LL only in patients with lumbar spondylolisthesis, but not in patients with lumbar spinal stenosis. Furthermore, there was greater FI of PSM in DLS patients with pelvic retroversion, higher PI angle (PI> 60°), and higher SS angle (SS> 45°), while this trend was not found in LSS patients. As seen in the present study, although there was weak correlation between the BR with the PSM FI in patients with lumbar spondylolisthesis and lumbar spinal stenosis, the multivariate analysis showed there was no difference between BR groups whatever in the DLS group or LSS group, which showed the BR is not the factor of FI in paraspinal muscle.
During spinal degeneration, PT gradually increases for compensating the loss of LL. As the pelvic retroversion increases, the distance from extensors, such as paraspinal muscles, to the center of the femur head (where the body’s center of gravity passes through) also increases accordingly, so paraspinal muscles need to provide more stretch to maintain spinal balance [22], which leads to more prone to the strain of the paraspinal muscles due to prolonged tension without adequate rest. However, this does not explain the absence of a significant increase in fatty infiltration of paraspinal muscles after the onset of pelvic retroversion in patients with lumbar spinal stenosis. It seems that there are other factors involved in the patients with lumbar spondylolisthesis themselves that led to the increase in FI due to the increase in PT observed in the present study.
In this study, we have found that spondylolisthesis is a risk factor for fatty infiltration of paraspinal muscles. Firstly, the mean FI of PSM and PMM was higher in DLS patients than in LSS patients. Furthermore, there was a positive correlation between FI of PSM and Meyerding grade in DLS patients, suggesting that the PSM FI increases with the more severity of spondylolisthesis. For the explanation, with the same pelvic parameters, the center of gravity in patients with spondylolisthesis shift forward to some extent compared to other spinal degenerative patients due to the intervertebral slippage, so the strength supported by the paraspinal muscles correspondingly increases to compensate for the sagittal balance and maintain the standing position, which may account for the increased FI. Enomoto et al. [24] compared the paraspinal muscles activity in patients with lumbar kyphosis and lumbar stenosis by surface electromyography, this study showed that there was more severe muscle fatigue in patients with lumbar kyphosis because of the anterior shift of the center of gravity while standing, which supported our view in another way.
During spinal degeneration, the pelvis tilts gradually posteriorly to compensate for the decrease in LL, i.e., the SS decreases, and the PT increases accordingly, while the sum of the 2 is PI, which is constant after puberty. On the other hand, the greater the PI value, the greater the ability of the spine to compensate for degeneration, which explains why the PSM FI is higher in patients with greater PI. Note that we observed higher PSM FI in patients with high SS (SS> 45°), along with a high PI in patients (PI > 60°), which we speculate PI is the main factor for the high FI of PSM.
Our findings may have implications for patients with degenerative lumbar diseases. Firstly, it is well known that patients with more PSM FI are often accompanied by a higher postoperative complication rate, such as infection [25]. Furthermore, this study found a positive correlation between PSM FI and symptom duration, operation time, and blood loss volume. Therefore, for patients with spondylolisthesis, especially those with high PT and PI, there are more fatty infiltration and weaker muscle strength in their paraspinal muscles, so it is essential for surgeons to review patients’ muscle condition regularly for early intervention and arrange reasonable postoperative rehabilitation supportive therapy such as enhancing the exercise for paraspinal muscles regularly and avoid prolonged loading. Besides, surgical manipulation may damage paraspinal muscles to a certain extent and then in turn affect the outcome [25]. Therefore, the Wiltse paraspinal approach and others that are less damaging to the muscles could be chosen to achieve a better recovery after the surgery.
As a retrospective study, there was selection bias as patients in this study were accompanied with different clinical symptoms and received different conservative treatments to some extent. However, limited by the incomplete clinical data, many confounding factors could not be excluded from this study. For example, the operating time and blood loss are often affected by the surgical segment, surgical procedure, and the prior receipt of conservative treatment. So, more rigorous prospective studies are needed to demonstrate these questions in the future, such as the comparative study of the PSM FI between patients treated conservatively versus surgically. Next, because the PSM FI was significantly higher in women than in men, subgroup analysis by sex should be performed. However, the subjects in some groups were too insufficient to make a considerate analysis. The strength of this study lies in correlating fatty infiltration of the paraspinal muscles with spinopelvic parameters in patients with DLS and identifies the significant effect of PT and PI.