Factors Predicting the Clinical Outcome After Trans-sacral Epiduroscopic Laser Decompression for Lumbar Disc Herniation
Article information

Abstract
Objective
Previous literatures have demonstrated widely variable clinical results after transsacral epiduroscopic laser decompression (SELD) and the factors predicting outcomes are not yet established. Therefore, we analyzed the clinical outcome and associated predictive factors of SELD in patients with lumbar disc herniation.
Methods
Between 2015 and 2018, 82 patients who underwent single-level SELD and followed up at least 6 months were enrolled. The overall success rate (excellent or good results at final follow-up) was 58.5% according to Odom’s criteria. Based on this result, patients were divided to 2 groups: a favorable group (n = 48) and an unfavorable group (n = 34). A retrospective review of the baseline characteristics and clinical outcome were conducted to reveal the predictive factors.
Results
As expected, improvement of pain and patient satisfaction, was more favorable in the favorable group (p < 0.05). Moreover, the rate of additional procedure was lower in the favorable group (4.2%, 2 of 48 patients) than in the unfavorable group (35.3%, 12 of 34 patients) (p = 0.011). Among the various baseline characteristics, the only significant predictive factor for favorable outcome was the presence of a high-intensity zone (HIZ) on preoperative magnetic resonance imaging (50.0% [24 of 48 patients] in the favorable group vs. 11.8% [4 of 34 patients] in the unfavorable group; odds ratio, 15.67; p = 0.024).
Conclusion
Although SELD for lumbar disc herniation resulted in a less favorable clinical outcome than that reported in previous studies, in patients with a HIZ, SELD can be an effective minimally invasive surgery to relieve low back pain and/or leg pain.
INTRODUCTION
The trans-sacral epiduroscopic laser decompression (SELD) was introduced to resolve a symptomatic epidural lesion of the lumbosacral spine with the development of small-caliber endoscope, flexible video-guided catheters, and less invasive laser technology since 2000s [1-5]. This minimally invasive spinal surgery has been performed as an option among various surgical techniques for treatment of diverse lumbar spinal diseases [4,6]. Many previous literatures have reported the clinical application of SELD in various epidural lesions of the lumbo-sacral spine, such as disc herniation, spinal stenosis, and failed back surgery [6-15].
In particular, in terms of the principle of lasers to condense hydrated materials, soft disc herniation with mild to moderate degree has been suggested as the appropriate indication of SELD [16-18]. According to previous studies, the clinical results of SELD for lumbar disc herniation was so varied that some reports suggested favorable outcome with a greater than 80% success rate [16,18-23], while others insisted unfavorable outcome with a lower than 60% success rate [17, 24].
However, to date, no reports have examined the reason of variations and predictive factors affecting clinical results after SELD in lumbar disc herniation. Therefore, we reviewed the patients with lumbar disc herniation after SELD with follow-up data of at least 6 months and analyzed the predictive factors affecting the outcomes.
MATERIALS AND METHODS
1. Indication and Patient Population
This study was approved by the Institutional Review Board of Gil Medical Center (GAIRB2018-214). The ethics committee waived the requirement for informed consent due to its retrospective character and all data were fully anonymized before we accessed them.
As demonstrated in author’s previous study about the clinical results of SELD [17], the indications of SELD were soft disc herniation with mild to moderate features on magnetic resonance imaging (MRI) concordant with low back pain and/or radiating leg pain despite sufficient conservative treatment at least 2 weeks or with severe pain making daily life impossible. The contraindication for SELD included cauda equina syndrome or motor weakness, hard calcified disc herniation, significant spinal stenosis, infection, hemorrhagic diathesis, and anatomical variations including closed sacral hiatus and peridural cyst [17].
A total of 116 patients who underwent SELD by 1 surgeon in a single institution between November 2015 and November 2018 were analyzed retrospectively. To minimize the selection bias, patients with multilevel procedure, previous history of lumbar spine surgery, and incomplete data of 6-month follow-up were excluded, and eventually, 82 patients were enrolled in final study cohort. Based on patient’s satisfaction at 6 months after surgery, final cohort was allocated to 2 groups; favorable group (n = 48) determined as “excellent” or “good” according to Odom’s criteria, and unfavorable group (n = 34) determined as “fair” or “poor” according Odom’s criteria (Fig. 1).

Selection of the final study cohort. SELD, sacral epiduroscopic laser decompression.
2. Operative Technique
Under local anesthesia of the sacral hiatus after prone position of the patients, a 5-mm skin incision and insertion of trocar via sacral hiatus were made under fluoroscopic guidance. After the entering of the trocar to the S2–3 level, a 3.2-mm diameter video-guided catheter containing 2 lumens was inserted through the trocar to the ventral epidural space of the target level using bidirectional steering characteristics. Through the video-guided catheter, a 1.0-mm diameter flexible epiduroscope and a 550-μm diameter flexible fiber of the Ho:YAG laser were advanced to the end of the catheter. The Ho:YAG laser with a 0.4-mm penetration depth and a 2,100-nm wavelength leads to effective ablation of the hydrated soft disc herniation without thermal injury to the adjacent neural structures including nerve root or thecal sac [5,25]. Protruded or ruptured discs was shrunk by a high-intensity laser of 8–10 W (0.8–1.0 J, 10 Hz) until the sufficient decompression of the nerve root. Direct visualization of the widening of the epidural space through the epiduroscope and epidurographic images showing flattened disc outlines and free flow beyond the lesion was considered to be the point of sufficient decompression. A 5–10 mL of solution mixture of lidocaine, dexamethasone, and methylprednisolone was injected into the epidural space at the end of the procedure.
3. Outcome Evaluation
The baseline characteristics such as demographic data including age and sex, body mass index, trauma history, previous history of nerve block, preoperative symptom duration, and surgical level were investigated.
Preoperative lumbar MRI and simple radiographs were performed in all patients. Based on these radiographic findings, disc degeneration based on the Pfirrmann grade [26], presence of high-intensity zone (HIZ) implying annular tearing, morphology of disc herniation (bulging, protruded, or extruded), location of the pathology (central, right, or left), degree of canal compromise (mild, moderate, or severe), grade of root compression (abutting, displace, near obliteration, or obliteration), degree of combined stenosis (none, mild, moderate, or severe), and volume index of the herniated disc were evaluated. The volume index of disc herniation was calculated as height of disc herniation× depth× transverse diameter× 1/2 of the protruded or ruptured disc fragment on MRI. In addition, degree of adhesion during surgery was subjectively classified according to the operator’s experience as mild, moderate, or severe.
The clinical outcomes based on visual analogue scale (VAS) of low back pain, VAS of radiating leg pain, and Odom’s criteria for patient’s satisfaction were collected preoperatively and at every follow-up visit (at 1 week, 1 month, and 6 months after surgery).
The surgical outcomes were assessed based on operation time, surgical failure, complications, hospital stay, and duration of return-to-work. In addition, the requirement of additional procedures including nerve block or revision surgery during follow-up were surveyed.
Plain and dynamic radiographies were performed at preoperation and at 6 months after surgery to assess the radiographic effect. Disc height was measured as an average of anterior and posterior disc height, and corrected using the ratio of disc height to the anteroposterior diameter of the L5 vertebral body to overcome any variations of x-ray magnification. Segmental angle and range of motion at the index level, and total lumbar lordotic angle were determined using Cobb method to assess the change in lumbar alignment.
4. Statistical Analysis
Data management and statistical analysis were performed using IBM SPSS Statistics ver. 23.0 (IBM Co., Armonk, NY, USA). Pearson chi-square test, independent t-test, and nonparametric Mann-Whitney U-test for comparison according to characteristics of the factors. Also, we performed a dichotomous logistic regression analysis of variables that were assumed to have a p-value less than 0.2 in univariate analysis. Results were expressed as means ± standard deviations, means with 95% confidence interval (CI), median with range, or odds ratio (OR), and statistical significance was accepted for p-values of < 0.05.
RESULTS
1. Clinical Outcomes, Surgical Outcomes, and Radiographic Outcomes Between the 2 Groups
A total of 82 patients were comprised of 52 men and 30 women, with a mean age of 40.78 ± 15.24 years.
In terms of the clinical outcome, as expected, low back pain in 1 week and 1 month after surgery; leg pain in 1 week, 1 month, and 6 moths; and Odom’s criteria in 1 week, 1 month, and 6 months were significantly better in the favorable group than in the unfavorable group (p < 0.05; independent t-test and Pearson chi-square test) (Table 1).
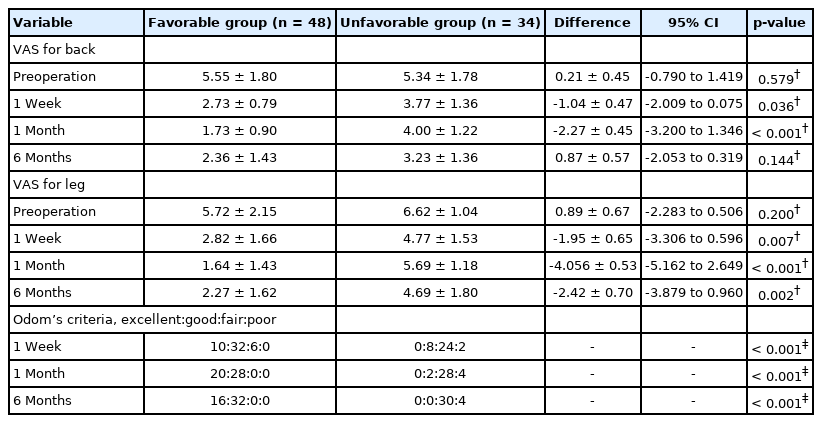
Difference in the clinical outcomes between the 2 groups
In terms of the surgical outcome, although the complication rate was not significantly different between the groups. Complications included 1 case of dura puncture, 2 cases of transient lower extremity weakness, and 4 cases of transient headaches or nuchal pain. The rate of additional procedure (revision surgery or additional nerve block), implying surgical failure or recurrence, were significantly lower in the favorable group than in the unfavorable group (4.2% [2 of 48 patients] vs. 35.3% [12 of 34 patients], p = 0.011; Pearson chi-square test) (Table 2).
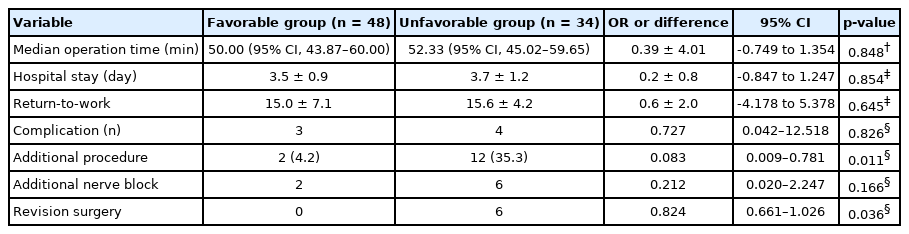
Difference in the surgical outcomes between the 2 groups
There was no difference in radiographic outcome between the 2 groups (Table 3).
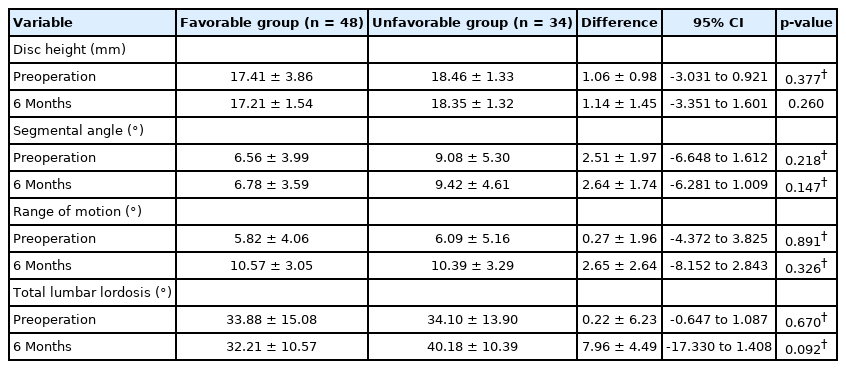
Difference in the radiological outcomes between the 2 groups
2. Univariate Simple Analysis to Find Predictive Factor
With the exception of low back pain as a dominant symptom, almost none of the baseline characteristics were significantly different between the 2 groups. Low back pain dominance was a significant predictive factor for the favorable group, (45.8% [22 of 48 patients] in the favorable group vs. 11.8% [4 of 34 patients] in the unfavorable group; OR, 6.35; p = 0.021; Pearson chi-square test) (Table 4).
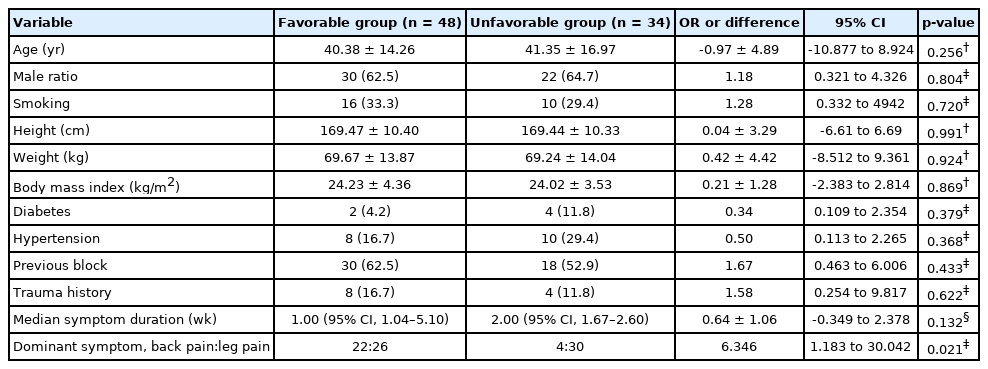
Demographic data and symptom-related characteristics of the 2 groups
Among the characteristics determined by preoperative MRI and intraoperative findings, the presence of HIZ (50.0% [24 of 48 patients] in the favorable group vs. 11.8% [4 of 34 patients] in the unfavorable group; OR, 7.52; p = 0.011; Pearson chi-square test) and the degree of nerve root compression (p = 0.048; Pearson chi-square test) were significantly different between the 2 groups (Table 5).
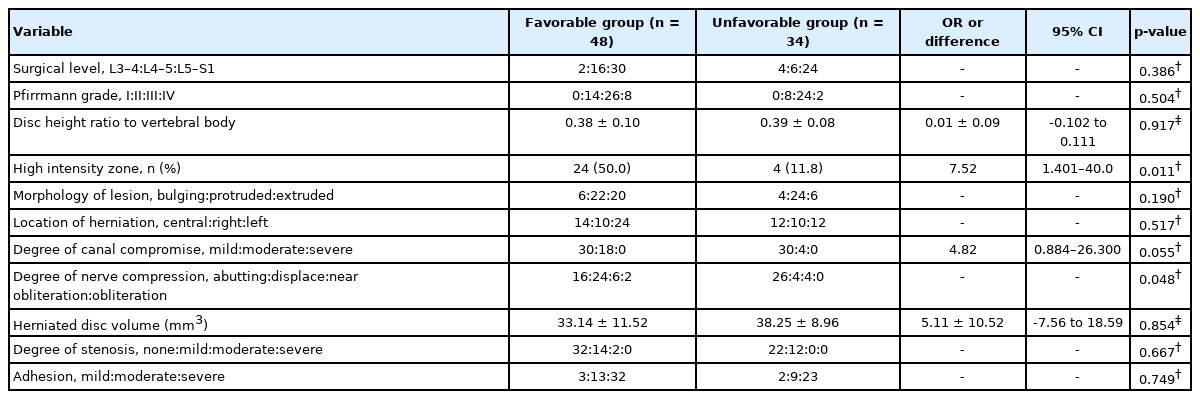
Dichotomous logistic regression analysis of various variables between the 2 groups
3. Dichotomous Logistic Regression Analysis for Finding Predictive Factor
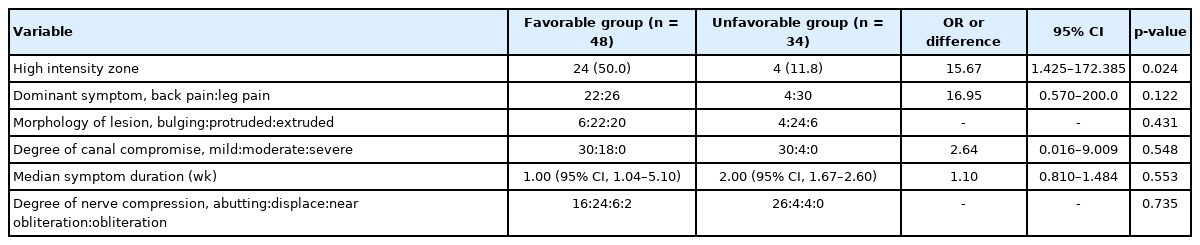
We performed a regression analysis to screen out clear predictive factors among the various baseline characteristic for the favorable group. In the previous univariate simple analysis, symptom duration, low back pain as a dominant symptom, presence of HIZ, morphology of lesion, degree of canal compromise, and degree of root compression showed meaningful values with p-value less than 0.2.
According to regression analysis of these meaningful factors, the HIZ on MRI (OR, 15.67; 95% CI, 1.425–172.385; p = 0.024) was the only significant predictive factor for the favorable group (Table 6). The correlation test showed no correlation between various factors.
Dichotomous logistic regression analysis of various variables between the 2 groups
DISCUSSION
Some previous literatures reporting the clinical results of SELD for lumbar disc herniation showed that the outcome was favorable, even compared to that of open discectomy or full endoscopic discectomy, in terms of the significant improvement in pain and the high patient’s satisfaction rate (more than 80%) [16,20,22,25,27]. However, according to the author’s previous study, the clinical result was different with that of previous literature as the lower patient’s satisfaction rate (58.5%) and the higher symptom recurrence rate (17.1%) during a minimum 6-month follow-up [17]. This result was not favorable compared to other minimally invasive surgical techniques for lumbar disc herniation.
There are a number of possible explanations for this in inconsistency with previous reports. First, the surgical proficiency of surgeons for SELD could affect the clinical result. We speculated that the outcome is not favorable in the early case series compared to the late case series, and this variation of surgical skill could affect the overall outcomes. However, in our previous study, both the surgical outcome and clinical outcome were not different between the early and late surgery groups [28]. Therefore, we speculated that the patient characteristics could affect clinical outcomes after SELD. For example, differences in detailed baseline characteristics such as demographic data, disc level, morphology of pathology could cause varied clinical outcomes. To find out which factors influence the prognosis after SELD, we compared the various factors between the favorable and unfavorable group.
In our study, as expected reasonably, the clinical outcome, including improvement of pain and patient satisfaction, and surgical outcome, including surgical failure or recurrence, were different between the 2 groups; the favorable group showed more favorable outcome than the unfavorable group. Consequently, we analyzed various factors that could influence the clinical result. Among these factors, according to regression analysis, the existence of a HIZ on preoperative MRI was the only significant predictive factor of the clinical outcome. If MRI showed a HIZ at the pathologic disc level, the effect of SELD was maximized, resulting in favorable outcomes after SELD.
A HIZ is defined as focal high signal intensity in the dorsal side of the disc beneath the posterior longitudinal ligament on T2-weighted MRI [29-31]. This bright area surrounded by a low signal intensity of the annulus fibrosus is clearly dissociated from the signal of nucleus pulposus and appreciably brighter than the water signal at the same level on sagittal T2-weighted MRI [29-31]. A HIZ on T2-weighted MRI may represent damage or tearing of the annulus fibrosus and hydrated inflammation of the tearing site [32-34]. Damage or inflammation of the annulus fibrosus can cause low back pain due to irritation of the sinuvertebral nerve or cause radiating leg pain due to irritation or compression of the concordant nerve root, although occasionally there are no related symptoms [35]. Consequently, according to previous studies, a HIZ is known to be correlated with discogenic low back pain [32,33,36].
With regard to mechanism of laser ablation, SELD could be effective when there are more focal lesions than diffuse lesions and more hydrated lesions than dehydrated lesions. Based on this concept, focal HIZ, i.e., a focal hydrated lesion, could be an optimal target of laser ablation, and the effect of laser ablation can be maximized compared to other soft disc herniation without HIZ. In other words, mild to moderate soft lumbar disc herniation with HIZ can be an optimal indication in performing SELD.
There are several limitations in this study. Because of its retrospective study design, it was difficult to control for all factors related to outcomes. In addition, the number of patients was relatively small and the study was limited in a single institute. However, this single-institute research could keep the quality of data and preclude the diversity of surgeon’s skill.
To the best of our knowledge, this is the first study to report on the predictive factor for successful SELD. Further studies with a larger number of patients or prospective studies are required to confirm the correlation between a specific predictive factor and the clinical result of SELD.
CONCLUSION
The only significant baseline predictive factor for the favorable outcome of SELD was the presence of a HIZ in the pathological disc on preoperative T2-weighted MRI. A favorable outcome can be expected when the patient is selected based on this optimal predisposing factor.
Notes
The authors have nothing to disclose.
Acknowledgements
This research was supported by the Gachon University and Gil Medical Center (Grant number: FRD2020-20).