Higher American Society of Anesthesiologists Classification Does Not Limit Safety or Improvement Following Minimally Invasive Transforaminal Lumbar Interbody Fusion
Article information

Abstract
Objective
The American Society of Anesthesiologists (ASA) physical status classification has been used to risk stratify surgical candidates. Our study compares outcomes of minimally invasive transforaminal lumbar interbody fusion (MIS TLIF) procedures based on preoperative ASA physical status classification.
Methods
A surgical registry was reviewed for primary, single-level MIS TLIF patients. Patients were categorized by preoperative ASA physical status classification: ASA I, ASA II, ASA III+. Perioperative complications were compared among groups. Patient-reported outcome measures (PROMs) for back pain, leg pain, physical function, and disability were recorded preoperatively and at 6-week, 12-week, 6-month, 1-year, and 2-year postoperative timepoints. PROM improvement from baseline (ΔPROM) and minimum clinically important difference (MCID) achievement was calculated for each timepoint and compared among groups. MCID achievement was determined as ΔPROMs that surpassed previously established MCID values.
Results
Of the 487 patients, 64 had an ASA classification of I, whereas 336 had an ASA of II, and 87 had an ASA of III or greater. Rates of complications were not associated with ASA classification (all p>0.050). Neither mean PROM scores nor ΔPROM scores were significantly associated with ASA classification at any timepoint (all p>0.050). MCID achievement was significantly associated with ASA classification for back pain at 1 year only (p=0.041). Overall MCID achievement was not significantly associated with ASA classification for any PROM (p>0.050).
Conclusion
While ASA classification has been commonly used to risk stratify surgical candidates for spinal procedures, patients with an ASA of III or greater may be able to achieve similar long-term outcomes following MIS TLIF given proper selection criteria.
INTRODUCTION
Minimally invasive transforaminal lumbar interbody fusion (MIS TLIF) has proven to be an efficacious treatment option for those experiencing degenerative spine pathologies such as central stenosis and spondylolisthesis while minimizing soft tissue trauma and disruption of posterior musculature [1]. As with many surgical procedures, evidence-based patient selection criteria are essential to performing MIS TLIF procedures safely and effectively. While a number of factors contribute to surgical decision making, the American Society of Anesthesiologists (ASA) physical status classification is widely used to assess the preoperative physical health of a patient [2]. Ranging from I–VI, the classification is determined through subjective assessment by an anesthesiologist, with a classification of I representing completely healthy patients and III representing a patient with severe systemic disease [3]. While the classification itself only accounts for the physical health of the patient, several past studies have demonstrated a correlation between ASA classification and operative outcomes such as postoperative complications, intraoperative blood loss, and overall morbidity and mortality [2]. Within the spine population, studies have reported a high ASA classification to be a significant risk factor for outcomes such as reoperation and readmission rates, postoperative complications, and greater direct costs [4-6]. However, some evidence suggests that these risks may be lower for minimally invasive spinal procedures [7]. In light of these conflicting findings, it is necessary to comprehensively address ASA classification in the context of various perioperative characteristics to better understand outcomes following MIS TLIF procedures specifically.
In addition to the more traditional objective assessment of operative outcomes, patient-reported outcome measures (PROMs) are self-reported questionnaires that allow clinicians to understand postoperative pain, disability and physical function from the patient’s perspective [8]. By quantifying PROM scores in terms of the minimum clinically important difference (MCID), a value that represents the minimum change in score a patient perceives as beneficial, clinicians can identify changes that are clinically significant to the patient [9]. While a significant number of studies have investigated ASA classification and perioperative outcomes in the spine population, there is limited literature focusing on ASA in the context of PROMs. The few studies that have addressed this topic have generally been overly broad to draw direct conclusions about ASA classification for specific populations, or were limited in their reporting of long-term outcome improvement [10,11]. This relative dearth of patient-centered data highlights the need to investigate the relationship between ASA classification and PROMs in the context of specific spine procedures.
ASA has been previously used as selection criteria to assess whether a patient is fit for surgery, but beyond this safety profile, there is limited literature to indicate whether the score can successfully predict a patient’s course of recovery. We aim to clarify this relationship and determine the value of ASA classification as a patient selection criterion for minimally invasive spine surgery, which may have important implications for clinical practice. Investigating ASA classification and PROMs, in addition to other perioperative characteristics, will improve the understanding of this scoring system’s effect on longitudinal, clinically significant outcomes.
MATERIALS AND METHODS
1. Patient Population
This study was approved by the Institutional Review Board of Rush University Medical Center (ORA #14051301) and written informed consent were obtained from patient prior to subject enrollment and data collection. Prospectively collected data was retrospectively reviewed via a private surgical database for minimally invasive lumbar fusion patients from January 2014 to February 2020. Inclusion criteria were patients undergoing primary, elective, single-level MIS TLIF procedures for degenerative spinal pathology. Exclusion criteria were patients missing a preoperative ASA classification or whose procedures were indicated for traumatic, infectious, or malignant etiologies. Additionally, to mitigate the confounding effects on outcomes following MIS TLIF, multilevel procedures were also excluded from the study. All procedures were performed by a single attending spine surgeon.
2. Data Collection
Patient demographic data was collected, including age, gender, body mass index (BMI), smoking status, and workers’ compensation status. Prevalence of various preoperative medical diagnoses were recorded for diabetes mellitus, acute immune deficiency syndrome (AIDS), history of myocardial infarction, neurological disease, arthritis, congestive heart failure, peripheral vascular disease, metastasis, liver disease, renal failure, chronic lung disease, and gastrointestinal bleeding. Prevalence of pre-existing spinal pathology was assessed for recurrent herniated nucleus pulposus, degenerative spondylolisthesis, and isthmic spondylolisthesis. Perioperative characteristics including operative duration (from skin incision to skin closure), estimated blood loss (EBL), and postoperative length of stay were recorded. Incidences of postoperative complications such as aspiration requiring reintubation, urinary retention, urinary tract infection, epidural hematoma, acute renal failure, postoperative anemia, altered mental status, venous thromboembolism, pulmonary embolism, pneumothorax, arrhythmia, ileus, pneumonia, atelectasis, pleural effusion, fever, or pancreatitis were recorded and confirmed via direct review of the electronic medical record. Specific circumstances and outcomes regarding confirmed complications were then reviewed and described.
PROMs were administered preoperatively and at 6-week, 12-week, 6-month, 1-year, and 2-year postoperative timepoints via a secure online portal and completed by patients either in the clinic using a provided electronic tablet prior to the appointment or at home using personal devices. Administered PROMs included the visual analogue scale (VAS) back, VAS leg, Oswestry Disability Index (ODI), 12-Item Short Form health survey physical composite score (SF-12 PCS), and Patient-Reported Outcomes Measurement Information System physical function (PROMIS PF).
3. Surgical Technique
Following localization of the appropriate spinal level via lateral fluoroscopy, an incision was made lateral to the midline and sequential dilators were used to gain exposure. A central laminectomy and bilateral partial facetectomy were performed. Following preparation of the endplates, an interbody cage along with bone graft was subsequently positioned in the interbody space. Bilateral pedicle screws were then placed above and below the level of interest and rods were attached to achieve compression.
4. Statistical Analysis
Patients were grouped according to their preoperative ASA classification based on a score of I, II, or III+. Demographic characteristics, preoperative medical and spinal pathology, and perioperative characteristics were compared between groups using chi-square or 1-way analysis of variance (ANOVA) for categorical and continuous variables, respectively. Rates of individual and total postoperative complications were compared between groups using Fisher exact test.
ΔPROM scores were calculated as the difference between preoperative values and each postoperative timepoint. Mean PROM scores and ΔPROM scores were compared among groups for each measure at each timepoint using 1-way ANOVA. Achievement of an MCID was determined by comparing ΔPROM score to previously established threshold values: 2.2 (VAS back) [12], 5.0 (VAS leg) [12], 8.2 (ODI) [12], 2.5 (SF-12 PCS) [12], and 4.5 (PROMIS PF) [13]. Rates of MCID achievement for each measure were compared among groups at each postoperative timepoint and overall using simple logistic regression.
RESULTS
A total of 487 MIS TLIF patients were included with an average age of 52.1 years. Of these, 64 patients had an ASA classification of I, whereas 336 had an ASA classification of II, and 87 had an ASA classification ≥ III. A majority of patients were male (57.1%), nonobese (BMI < 30 kg/m2), and nonsmokers (83.0%) (Table 1). ASA groups significantly differed on the basis of age (p<0.001), BMI (p<0.001), and workers’ compensation status (p=0.003). Prevalence of diabetes (p<0.001), AIDS (p=0.001), myocardial infarction (p<0.001), hypertension (p<0.001), neurological disease (p<0.001), arthritis (p<0.001), congestive heart failure (p=0.031), and peripheral vascular disease (p=0.010) were significantly associated with ASA groups. Preoperative spinal pathology did not significantly vary between ASA groups (all p>0.05). Operative duration was significantly associated with ASA groups (p=0.013), while EBL (p=0.792) and postoperative length of stay (p=0.089) were not (Table 2). A total of 5 patients experienced urinary retention, 3 urinary tract infection, 2 epidural hematoma, 1 acute renal failure, 3 postoperative anemia, 1 altered mental status, 1 arrhythmia, 1 ileus, 1 atelectasis, and 1 pancreatitis. No individual complication type nor total complication rates were significantly associated with ASA groups (all p>0.05) (Table 3). Circumstances and outcomes of individual complications are detailed in Table 4.

Patient demographics and baseline characteristics

Perioperative characteristics

Postoperative complications

Individual incidences of complications and associated outcomes
Neither mean PROM scores nor ΔPROM scores significantly differed based on ASA group at any timepoint for any measure (all p>0.05) (Tables 5, 6). MCID achievement significantly varied among ASA groups for VAS back at 1 year only (p=0.041), but did not vary for any other individual timepoints nor overall (all p>0.05) (Table 7).

Patient-reported outcomes
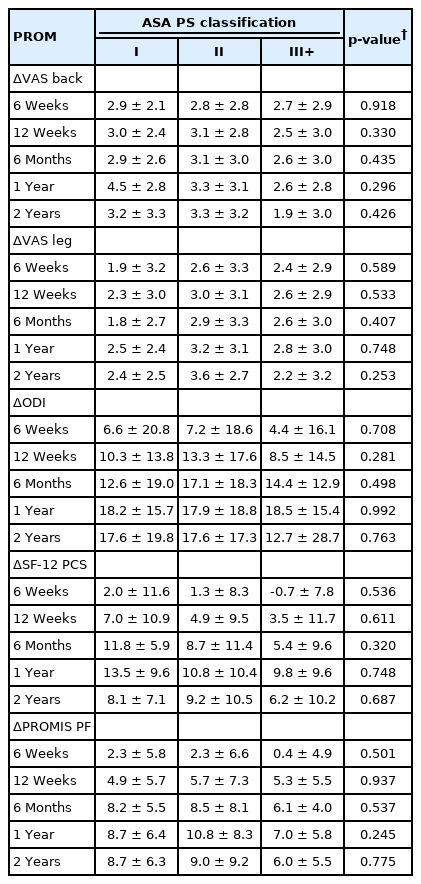
Postoperative improvement (ΔPROM scores)

MCID achievement
DISCUSSION
ASA classification has been viewed as a concise way of conveying a patients’ general physical health status and thereby, their risk of undergoing general anesthesia. While higher ASA scores have been used by many spine surgeons as a key part of their patient selection criteria, literature supporting the utility of this measure is somewhat limited in the field of spine surgery. Furthermore, beyond the immediate perioperative period, the impact of ASA classification on more long-term patient-reported outcomes is relatively unreported. While ASA classification was clearly associated with increased medical comorbidity in our cohort, differences in perioperative outcomes were relatively minor and impact on long-term clinical improvement was negligible.
Our cohort demonstrated clear associations between a number demographic factors, as well as several significant medical comorbidities. Age was significantly associated with ASA classification, with each progressive ASA group demonstrating older mean ages than the group below. While a majority of the overall cohort had a BMI <30 kg/m2, over 70% of the ASA III+ group was obese. Interestingly, workers’ compensation patients made up the majority of the ASA I group only. To some degree, this is an expected distribution as those individuals who are able to claim workers’ compensation are typically of age or physical ability to participate in the workforce. Past comparative studies have also noted this significant difference, whereby patients categorized as workers’ compensation were significantly younger and had a lower comorbidity burden [14]; both potential signs of reduced systemic disease burden. It would be more surprising to see a larger proportion of patients with an ASA of II or III+ who, by definition of the scoring system, would be dealing with mild to severe systemic disease, but nonetheless remain in the workforce. Unsurprisingly, both relatively severe cardiovascular pathology and more common diagnoses such as arthritis and hypertension were associated with increasing ASA classification. These strong statistical relationships between ASA classification and medical comorbidity are consistent with the measures’ intended purpose and can be seen as confirmation that the appropriate classification was assigned [15,16].
ASA physical status classification has been suggested as a tool for preoperative risk stratification in spine surgery by a number of previous studies [4,5,17-19], although it should be noted that this was not the measure’s originally intended purpose. Rather, the ASA classification was designed to be used as a concise way of conveying a patient’s health status, primarily for statistical analysis and interprovider communication. Nonetheless, a host of researchers have reported greater rates of complications, extended postoperative stay, and readmissions among spine patients with an ASA classification > II [5,17–19]. Specific to the posterior approach, prior studies looking at 30-day readmissions and complication rates noted that patients with an ASA > III who underwent either a posterior lumbar interbody fusion or TLIF were at increased risk (odds ratio, 1.411; p<0.001; 95% confidence interval, 1.177–1.692) [20]. Additionally, Ondeck et al. [21] analyzed approximately 16,500 posterior lumbar fusion patients and was able to demonstrate that ASA was particularly meaningful as a predictor of severe postoperative adverse events and extended length of stay, which was further supported by a multivariate analysis of posterior lumbar fusion patients [22]. However, this may be a reflection of inherent differences between the 2 types of posterior fusion procedures, whereby MIS TLIF is associated with lower complication rate (8.7% vs. 17.0%) and odds ratio (OR, 0.47; 95% CI, 0.28–0.81; p=0.006) [23].
Our analysis among MIS TLIF patients failed to replicate this predictive value of ASA for perioperative morbidity. Interestingly, operative duration was significantly greater for patients with the highest ASA classifications; however, EBL and length of stay, which might be more expected to correlate with increasing ASA, did not demonstrate significant associations with this measure. Overall, complications were quite rare amongst our cohort, which may be attributable to a combination of careful patient selection, minimally invasive surgical techniques, and the expertise of an experienced surgeon that regularly performs a high volume of MIS TLIF procedures. Nonetheless, the few complications that were observed were distributed relatively evenly among the 3 groups and demonstrated no significant associations with ASA classification. Given previous reports of increased surgical morbidity among patients with an ASA classification > II, some surgeons may view this threshold as an attractive criterion for patient selection, particularly for outpatient/ambulatory orthopaedic surgery [19,24,25]. However, our results demonstrate that this practice may be too conservative and exclude patients who would otherwise safely benefit from minimally invasive spinal procedures. The current study is not alone in these findings; in fact, Narain et al. [7] similarly reported that an ASA classification > II was not significantly associated with greater rates of medical or surgical complications following minimally invasive lumbar fusion procedures.
While a relatively substantial body of literature exists regarding the relationship between ASA classification and propensity for perioperative complications and adverse outcomes, research regarding the impact of ASA classification on patient-reported outcomes is much more limited. McGirt et al. [10] conducted one of the few studies to assess the relationship of ASA classification with PROM scores. These authors used a large national database to create predictive models for outcomes among all elective lumbar procedures and determined that, among a variety of other factors, higher ASA classification was associated with worse 12-month outcomes in disability, pain, and quality of life following elective lumbar spinal surgery. While McGirt et al. [10] did include improvement in PROM scores and achievement of MCID as outcomes in their relatively complex predictive model - detailed via 2 “hypothetical patients,” they only reported direct analysis of the effects of ASA on mean PROM scores at preoperative and 12-month postoperative timepoints. This methodological/reporting choice, along with the significant heterogeneity of their population (single and multilevel, primary and revision, as well as a variety of procedure types) precludes meaningful conclusions about the direct relationship of ASA classification with postoperative improvement in patient-reported outcomes. Yoo et al. [11] performed a more focused analysis of the impact of ASA classification on PROMS for TLIF procedures in particular, and determined that ASA classification was associated with improvement in VAS back, but not VAS leg, ODI, or SF-12 PCS. However, this analysis was also limited to 6-month outcomes and did not include quantification of MCID achievement.
Given the conflicting results and methodological limitations of these previous studies, it is important to directly and longitudinally assess the impact of ASA classification on patients’ ability to achieve meaningful clinical improvement following minimally invasive lumbar fusion. Despite our use of a relatively large cohort to facilitate well-powered statistical analysis, we were unable to demonstrate any significant differences between ASA groups either in mean PROM scores or ΔPROM improvement at any of the assessed timepoints. Furthermore, analysis of MCID achievement showed no significant impacts of ASA for any of the assessed PROMs either overall or at individual timepoints through 2-years postoperatively, with the exception of VAS back at 1 year. These results allow for a more pertinent assessment of the relevance (or lack thereof) of ASA classification for this specific population because of our focused selection of only patients undergoing primary, single-level MIS TLIF procedures and our collection longitudinal PROM data throughout the full 2-year postoperative period.
One major potential shortcoming of the ASA classification is its relatively subjective assignment criteria. Several previous studies have demonstrated questionable interrater reliability in ASA classification assignment. Among 97 anesthesiologists in Hong Kong asked to classify 10 hypothetical patients, overall agreement on classification was below 60% for all but 1 patient (for whom agreement was 67%), and was as low as 36% for one patient [26]. An overall Cohen’s Kappa of 0.34 was reported, indicating only fair reliability of rating between observers. These findings were consistent with those previously reported by an older, United States-based study by Owens et al. [27]. This potential for inconsistency, coupled with the lack of significant effects either in terms of safety profiles or patient-reported outcomes may be cause to question the utility of ASA classification for some populations. Specifically, limiting selection criteria for MIS TLIF procedures to patients with an ASA classification ≤ II may exclude some patients that could otherwise stand to safely and significantly benefit from outpatient MIS TLIF. Physicians that are sufficiently experienced in minimally invasive surgical techniques may consider removing ASA classification as part of their patient selection criteria for outpatient surgical procedures.
The present study represents one of the most comprehensive assessments of the association of ASA classification with surgical outcomes specifically for MIS TLIF patients. However, our findings should be considered in the context of several limitations. First, while a moderately large sample was included, the single-surgeon, single-institution nature of this analysis may limit generalizability to other providers and populations. Additionally, previous studies have demonstrated variability in the assignment of ASA classification between different institutions and different regions [26]. Furthermore, while this study included patients with a range of ASA classifications from minimal to severe disease, patients were carefully vetted and selected by an experienced minimally invasive spine surgeon, which may play an important role in the favorable outcomes demonstrated in patients with higher ASA classification.
CONCLUSION
Increasing ASA classification was significantly associated with greater prevalence of a variety of medical comorbidities. However, while operative duration was significantly longer for patients with higher ASA classification, other perioperative outcomes were similar for all patients and rates of complications were favorable regardless of ASA classification. Similarly, patient-reported outcomes in pain, disability, and physical function including mean scores, absolute improvement, and achievement of MCID did not significantly vary based on preoperative ASA. Therefore, we recommend that ASA classification > II should not necessarily preclude otherwise appropriate patients from undergoing MIS TLIF procedures, even in the outpatient setting.
Notes
Conflict of Interest
The authors have nothing to disclose.
Funding/Support
This study received no specific grant from any funding agency in the public, commercial, or not-for-profit sectors.
Author Contribution
Conceptualization: CL, EC, KS; Data curation: CL, EC, CJ, SM, CG, KS; Formal analysis: CL, EC, KS; Methodology: CL, EC, KS; Project administration: CL, EC, CJ, SM, CG, KS; Visualization: CL, EC, CJ, SM, CG, KS; Writing - original draft: CL, EC, CJ, KS; Writing - review & editing: CL, EC, CJ, SM, CG, KS.