Prevalence, Distribution, and Concomitance of Whole-Spine Ossification of the Posterior Longitudinal Ligament and Ossification of the Ligament Flavum in South Koreans: A Whole-Spine-CT-Based Cross-Sectional Study
Article information

Abstract
Objective
No studies assessing the prevalence of ossification of the spinal ligament were conducted using whole-spine positron emission tomography and computed tomography (PET-CT) in healthy Koreans. We aimed to determine the prevalence of ossification of the posterior longitudinal ligament (OPLL) and ossification of the ligament flavum (OLF) in healthy Koreans using whole-body PET-CT.
Methods
We reviewed whole-body PET-CT images captured during general health checkups at the General Health Promotion Center of our institution from January 2015 to 2020. OPLL and OLF were identified by the presence of heterotopic ossification in the posterior longitudinal ligament and ligament flavum on axial and sagittal PET-CT images.
Results
A total of 1,934 adults (1,645 men, 289 women) were included. The mean age was 48.05 years (range, 28–86 years). Among the 1,934 patients, 173 had OPLL (8.9%). The most commonly involved cervical vertebra levels arranged according to frequency were C4, C5, C3, and C6. OLF was observed in 125 patients (6.5%). The most commonly involved thoracic levels were T10, T11, and T5. The prevalence of OPLL and OLF was the highest in patients aged 60–69 years. Among the C-OPLL patients, 15.1% had T-OPLL, 5.0% had L-OPLL, and 25.8% had T-OLF.
Conclusion
Our study revealed the prevalence of OPLL and OLF in healthy Korean subjects. It was consistent with that in other Asian countries. The presence of OPLL and OLF at most locations correlated with the presence or absence of spinal ossification at other locations.
INTRODUCTION
Ossification of the spinal ligament is characterized by heterotopic bone formation in the posterior longitudinal ligament, which results in the compression of the spinal cord and possibly leads to neurological deterioration; this condition is often associated with other forms of paravertebral ligament ossification. Traditionally, many studies on the ossification of the spinal ligament were performed using radiographs; however, the diagnostic accuracy associated with this method was relatively low. Recently, with the developments in radiographic diagnostic technology, studies on the prevalence of this condition were conducted using computed tomography (CT) or magnetic resonance imaging (MRI).
Two studies conducted in other countries evaluated the prevalence of ossification of the spinal ligament using whole-body positron emission tomography and CT (PET-CT). Fujimori et al. [1] reported that the prevalence of cervical ossification of the posterior longitudinal ligament (C-OPLL) is 6.3% and that of thoracic ossification of the ligamentum flavum (T-OLF) is 12% in Japan. Liang et al. [2] reported that the prevalence of C-OPLL is 4.1% and that of T-OLF is 37.65% in China. In South Korea, a few studies on the prevalence of C-OPLL and T-OLF were conducted using various diagnostic imaging modalities. Sohn et al. [3] reported on the prevalence of C-OPLL (5.7%) using thyroid CT. Moon et al. [4] reported on the prevalence of T-OLF (16.9%) using whole-spine sagittal MRI. Kim et al. [5] reported on the prevalence of T-OLF (21.8%) using chest CT. However, no studies assessing the prevalence of ossification of the spinal ligament were conducted at the whole-spine level based on CT images in healthy Korean people. For these reasons, in this study, we aimed to determine the prevalence, distribution, and concomitance of OPLL and OLF based on whole-spine CT images in randomized Korean populations.
MATERIALS AND METHODS
1. Subjects
This study was conducted on adults who underwent PET-CT (Discovery PET/CT 710, GE Healthcare, Chicago, IL, USA) scans as part of health checkups during the period from January 2015 to January 2020. Research data were provided by the General Health Promotion Center of Dong-A University Hospital, Busan, Korea. No patient consent was required for the use of images and records because the anonymity of the participants was ensured. The exclusion criteria were cancer, inflammation, infection diagnosed by PET-CT, history of spine surgery, and foreign ethnicity. As a result, 1934 participants were enrolled: 1,645 men and 289 women. The age range was 28-86 years, with a mean age of 48.05±8.49 years.
2. Image Assessment
We obtained whole-body CT data from participants who underwent PET-CT scans. Slice thickness was 2.5 mm in axial CT images. Automatic exposure control was used (range, 100–240 mA) at 120 kV. The scan range was from the head to the pelvis. PACS software (PACS, INFINITT PACS M6, INFINITT Healthcare Co, Seoul, Korea) was used to confirm the presence of ossification of the spinal ligament. OPLL was identified through the presence of heterotopic ossification in the posterior longitudinal ligament. OLF was identified through the presence of heterotopic ossification in the ligamentum flavum. OPLL was evaluated based on the levels of the vertebral bodies exhibiting ossification. OLF was evaluated based on the levels of the laminae involved in ossification. First, reconstruction sagittal images were examined to assess the presence and level of ossification, and ossification was confirmed by rechecking the axial PET-CT image (Fig. 1). All the PET-CT images were reviewed by 2 experienced spine surgeons. To obtain more reliable results, the image review was performed twice, and any disagreements were resolved through a discussion.
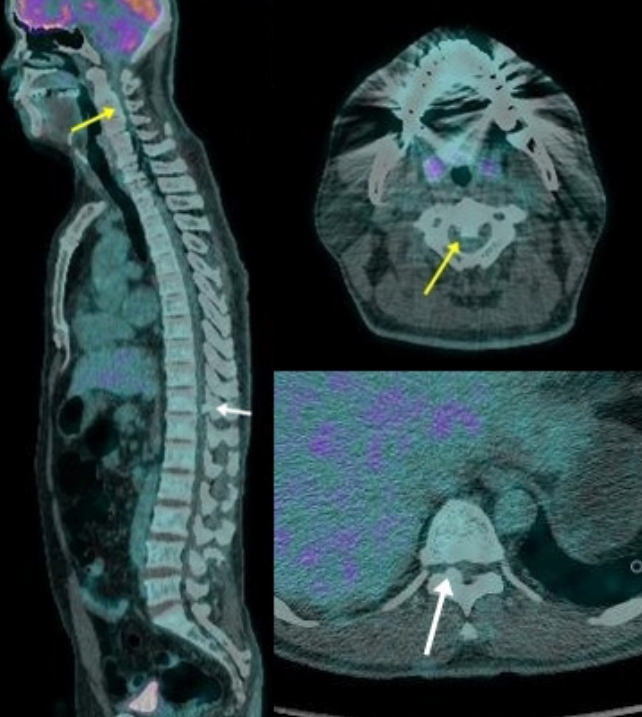
Positron emission tomography and computed tomography image of a 44-year-old man. The patient had cervical ossification of the posterior longitudinal ligament (yellow arrow), and thoracic ossification of the ligamentum flavum (white arrow).
3. Statistical Analysis
IBM SPSS Statistics ver. 28.0 (IBM Co., Armonk, NY, USA) was used to perform the statistical analysis. The difference in the prevalence of ossification according to sex was analyzed using the chi-square test or Fisher exact test. The increase in the prevalence of ossification with age was analyzed using the linear-by-linear association test. Concomitance of OPLL and OLF was analyzed using the chi-square test or Fisher exact test. p-values less than 0.05 were regarded as statistically significant.
RESULTS
1. Prevalence of OPLL and OLF
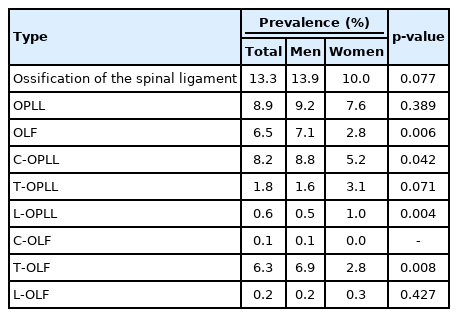
Table 1 presents the prevalence rate of ossification of the spinal ligament. A total of 1,934 patients (1,645 men and 289 women) were included in this study. The mean age of these patients was 48.05±8.49 years (range, 28–86 years). Among the 1,934 patients, 257 patients exhibited ossification of the spinal ligament (228 men and 29 women). The prevalence rate of spinal ligament ossification was 13.3% (men, 13.9%; women, 10.0%). A total of 173 patients had OPLL (151 men and 22 women). The prevalence rate of OPLL was 8.9% (men, 9.2%; women, 7.6%). A total of 159 patients had C-OPLL (144 men and 15 women). The prevalence rate of C-OPLL was 8.2% (men, 8.8%; women, 5.2%). A total of 35 patients had thoracic (T)-OPLL (26 men and 9 women). The prevalence rate of T-OPLL was 1.8% (men, 1.6%; women, 3.1%). A total of 12 patients had lumbar (L)-OPLL (9 men and 3 women). The prevalence rate of L-OPLL was 0.6% (men, 0.5%; women, 1.0%). The prevalence of OPLL was significantly different between men and women at the cervical (p < 0.042) and lumbar (p < 0.004) levels. A total of 133 patients had OLF (125 men and 8 women). The prevalence rate of OLF was 6.5% (men, 7.1%; women, 2.8%). In total, only one patient had C-OLF (1 man and 0 women). The prevalence rate of C-OLF was 0.1% (men, 0.1%; women, 0%). A total of 121 patients had T-OLF (113 men and 8 women). The prevalence rate of T-OLF was 6.3% (men, 6.9%; women, 2.8%). A total of 4 patients had L-OLF (3 men and 1 woman). The prevalence rate of L-OLF was 0.2% (men, 0.2%; women, 0.3%). The prevalence of OLF was significantly different between men and women at the whole-spine (p < 0.006) and thoracic (p < 0.008) levels.
Prevalence rate of each type of spinal ligament ossification
2. Segmental Distribution of OPLL and OLF
Fig. 2 shows the segmental distribution of OPLL. The most common location of C-OPLL was C4 (106 cases), followed by C5 (103 cases), C3 (85 cases), and C6 (85 cases). The most common location of T-OPLL was T6 (13 cases), followed by T1 (11 cases), T5 (10 cases), and T7 (10 cases). In men, the prevalence of OPLL was remarkably high at the cervical spine level in the following order: C4 (100 cases), C5 (95 cases), and C3 (79 cases); however, there was no significant difference in the distribution at the cervical and thoracic levels in women. The prevalence of OPLL in women was the highest in C6 (9 cases), followed by C5 (8 cases) and C3, C4, T7 (6 cases). Fig. 3 shows the segmental distribution of OLF. In most cases, OLF was located at the thoracic level. Bimodal distribution was observed in the case of whole-spine OLF. OLF was most commonly seen in T10 (54 cases), followed by T11 (52 cases) and T5 (25 cases). In men, the prevalence of OLF was the highest in T10 (50 cases), followed by T11 (47 cases) and T5 (25 cases), and in women, it was highest in T11 (5 cases), followed by T10 (4 cases) and T12 (2 cases).
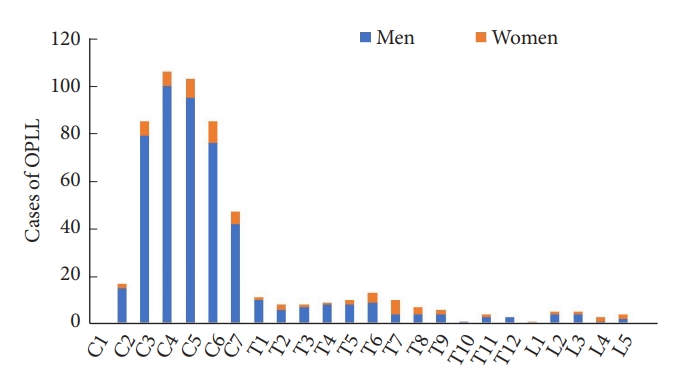
Segmental distribution of ossification of the posterior longitudinal ligament (OPLL).

Segmental distribution of ossification of the ligamentum flavum (OLF).
3. Age Distribution of Patients Based on OPLL and OLF
Table 2 shows the prevalence and average number of lesions with OPLL and OLF in each decade of life after the age of 20 years. The prevalence of ossification tended to increase in the older age group. The prevalence of OPLL was the highest in patients aged 60–69 years and over 70 years. Likewise, the prevalence of OLF was the highest in patients aged 60–69 years and over 70 years. There was a significant difference in the prevalence of OPLL based on age (p < 0.001). There was no significant difference in the prevalence of OLF based on age (p < 0.094). Similarly, the number of lesions with spinal ligament ossification also tended to increase with age. The average number of lesions with OPLL was the highest in the 60- to 69-year-old group. The average number of lesions with OLF was the highest in the over 70-year-old group. There was a significant difference in the number of lesions with OPLL based on age (p < 0.040). There was no significant difference in the number of lesions with OLF based on age (p < 0.162).

Age distribution of patients with OPLL and OLF
4. Concomitance of OPLL and OLF
Table 3 presents the concomitance among C-OPLL, T-OPLL, L-OPLL, T-OLF, and L-OLF. Among all the patients with C-OPLL, 15.1% had T-OPLL, 5.0% had L-OPLL, and 25.8% had T-OLF. Among all the patients with T-OPLL, 68.6% had C-OPLL, 14.3% had L-OPLL, and 20% had T-OLF. Among all the patients with L-OPLL, 66.7% had C-OPLL, 41.7% had T-OPLL, and 33.3% had T-OLF. Among all the patients with T-OLF, 33.9% had C-OPLL, 5.8% had T-OPLL, 3.3% had L-OPLL, and 1.7% had L-OLF. C-OPLL, T-OPLL, L-OPLL, T-OLF, and L-OLF were significantly correlated with each other.

Concomitance of OPLL and OLF
DISCUSSION
In this study, we verified the prevalence of OPLL and OLF in Koreans using PET-CT. Our results revealed the following prevalence rates: OPLL, 8.9%; OLF, 6.5%; C-OPLL, 8.2%; T-OPLL, 1.8%; L-OPLL, 0.6%; C-OLF, 0.1%; T-OLF, 6.3%; and L-OLF, 0.2%.
The prevalence of OPLL, which was previously studied using plain radiographs, was relatively lower than that in studies using recently developed imaging techniques, such as CT and MRI. In studies based on plain radiographs in East Asians, the prevalence of C-OPLL varied from 0.60% to 4.1% [6-8], that of T-OPLL varied from 0.56% to 0.8% [9,10], and that of T-OLF varied from 4.5% to 6.2% [10,11]. Recently, with the development of imaging modalities, such as CT and MRI, the sensitivity in detecting ossification of the spinal ligament has increased. Sohn et al. [3] used thyroid CT and reported that the prevalence of C-OPLL was 5.7% in the Korean population. Moon et al. [4] used MRI and reported that the prevalence of T-OLF was 16.9% in the Korean population. Kim et al. [5] used chest CT and reported a T-OLF prevalence of 21.8% in the Korean population. In the Japanese population, the following prevalence rates were found based on PET-CT: C-OPLL, 6.3%; T-OPLL, 1.6%; L-OPLL, 0.7%; T-OLF, 12%; and L-OLF, 0.3% [1]. In the Chinese population, the following prevalence rates were found based on PET-CT: C-OPLL, 4.1%; T-OPLL, 2.25%; L-OPLL, 0.8%; T-OLF, 37.65%; and L-OLF, 1.45% [2]. In the Indian population, the following prevalence rates were found based on whole-body CT: C-OPLL, 5.12%; T-OPLL, 0.56%; and T-OLF, 9.90% (Table 4) [12]. The prevalence of spinal ligament ossification in this study was consistently similar to that in previous studies based on CT and MRI. However, the prevalence of T-OLF in our study was relatively lower than that in other studies involving the Korean population and other Asian populations. Moon et al. [4] investigated patients complaining of back pain, and Kim et al. [5] included patients suffering from pulmonary disease; therefore, it is thought that there was selective bias in the patient groups. Moreover, there is a difference in the age distribution of the population. The average ages were 56 years and 60.9 years in the studies by Moon et al. [4] and Kim et al. [5], respectively, which were higher than that of this study. In both studies, the age distribution of the population was high; thus, the proportion of the elderly population would have been relatively higher than in this study. For this reason, the T-OLF prevalence seemed relatively low in this study. Although Fujimori et al. [1] did not report the age distribution in detail, the average age and standard deviation in their study were higher than in this study, suggesting that the prevalence was higher. It is unclear why Liang et al. [2] have a higher prevalence compared to this study. It is believed that there may be a genetic or lifestyle-related cause for the difference in the prevalence rate in each country [13,14]; however, more detailed research is needed.
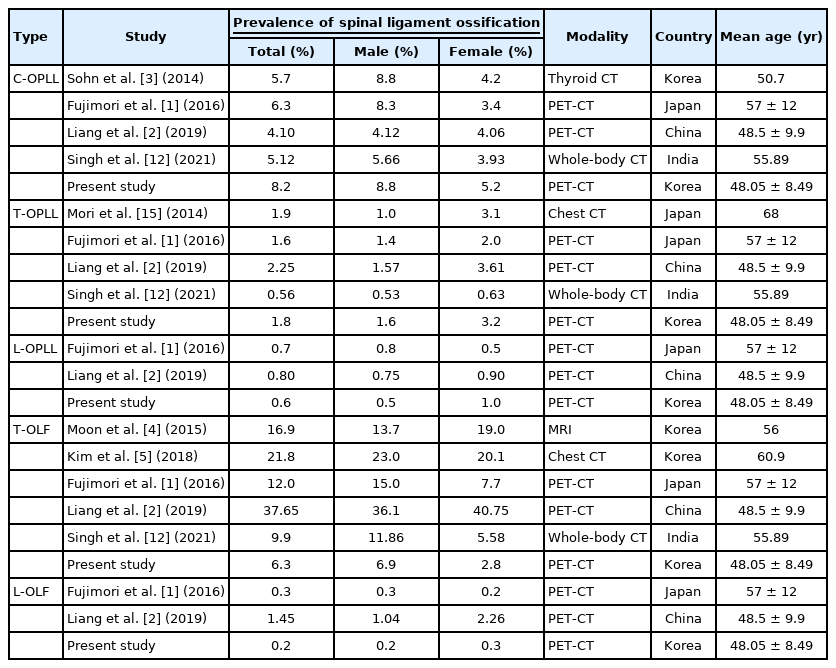
Prevalence of spinal ligament ossification in other studies
In this study, the prevalence of C-OPLL was approximately twice as high in men than in women, and this finding corresponded to that in previous studies [1,3,12]. The prevalence of T-OPLL was higher in women than in men, which was consistent with the findings of previous studies [1,2,12,15]. However, the difference in the prevalence of T-OLF among men and women was inconsistent with that in previous studies. In some studies, the prevalence of T-OLF was higher in women than in men [2,4,16], while in others, it was higher in men than in women [1,5,12,17]. In this study, the prevalence of T-OLF was approximately twice as high in men than in women, and this difference was significant (men, 6.9%; women, 2.8%; p < 0.008). It remains unclear whether T-OLF is more prevalent in men or women.
The prevalence of C-OPLL was the highest in C4 (19.2%), followed by C5 (18.7%), C3 (15.4%), and C6 (15.4%). In other studies, the overall prevalence of C-OPLL was the highest in C5, followed by C6 and C4 [1-3]. It is presumed that the prevalence of OPLL was high in C3 in this study compared to other studies due to the relatively high number of male patients. Sohn et al. [3] reported that the prevalence of OPLL was significantly higher at the C3, C4, C5, and C6 levels in men. Therefore, in this study, the prevalence at the C3 level was relatively high compared with in previous studies.
In previous studies based on plain radiographs, it was reported that T-OPLL occurred most frequently in T6 [10,18]. However, in recent studies based on CT images, T-OPLL occurred most frequently in T1 [1,2,12]. On plain radiographs, many bony structures, such as the shoulders and ribs, were found to mask upper thoracic OPLL; therefore, OPLL was not detected at the upper level of the thoracic spine [19]. In this study, the prevalence of T-OPLL was the highest in T6, followed by T1, and there was little difference in the values: the prevalence was 2.4% in T6 and 2.0% in T1. These results are somewhat consistent with those of recent studies on T-OPLL. The distribution pattern of OPLL was roughly consistent with that in previous studies [1,2].
The distribution pattern of OLF in this study was similar to that in previous studies. The distribution of OLF exhibited a bimodal pattern. OLF occurs most frequently in T10 and T11, followed by T5 and T4. The true ribs transition to the floating ribs at the T10 and T11 level, and the kyphotic curve changes to the lordotic curve; therefore, stability is lost at this level. It is considered that this characteristic causes repetitive and high tensile stress, thereby leading to ossification [20,21]. The second peak in the segmental distribution of OLF was consistent with that in previously published reports. However, there was a difference in the level of the second peak, and most previous studies reported a second peak at the T3 level [1,4,5]. Liang et al. [2] reported a second peak at T4, and Mori et al. [17] reported a second peak at T4/5. The presumed reason for the occurrence of the second peak is that the kyphotic curve angle is high at T5, and thus, the mechanical stress is also high. Kim et al. [5] reported that T-OLF patients had more pronounced thoracic kyphosis. The reason for the occurrence of the second peak at the upper level of the thoracic spine is still unclear, and further research is needed on this subject.
The prevalence of OPLL and OLF increases with age. The number of lesions with OPLL and OLF also tends to increase with age. We found a significant relationship between age and the prevalence of OPLL. This finding was consistent with the results of previous reports [1-3]. The prevalence of OLF tended to increase with age. On the other hand, there was no significant relationship between age and the prevalence of OLF in this study. This tendency was consistent with that in previous studies, but the statistical significance was different. Kim et al. [5] reported that the relationship between age and the prevalence of T-OLF was not significant, whereas Moon et al. [4] reported that there was a positive correlation between age and T-OLF prevalence. Further data and studies are warranted for investigating the statistical correlation between age and the prevalence of OLF.
This study shows that the coexistence of spinal ligament ossification at different levels was high. Several past studies have reported that patients with C-OPLL also have ossification in other areas of the spine [22,23]. Fujimori et al. [1] reported that T-OPLL patients have a systemic tendency to develop ossification. In this study, even in healthy people, the presence of OPLL and OLF in all the locations was correlated with the presence or absence of spinal ossification in other locations. Prior to treating patients with locally observed OPLL or OLF, it should be determined whether ossification in other areas may become symptomatic. Additionally, we recommend performing an evaluation through whole-spine CT to determine whether ossification is present at any other level.
This study has several limitations. First, PET-CT performed at this institute did not provide data related to the bone setting view. The resolution of the PET-CT fusion image was relatively lower than that of the bone setting view; therefore, we could only check for the presence or absence of ligament ossification. It is also possible that we were not able to identify cases with subtle ossification. Therefore, there is a possibility that the reported prevalence rate is lower than the actual prevalence rate. Second, the male to female ratio was not uniform. There were many more men than women in the subject group. In addition, since treatment agreements were made between heavy industry and electric companies and this hospital, bias resulting from occupations must be considered. Despite these limitations, this is the first study of the prevalence of ossification in healthy Koreans, and we believe that the results of this study sufficiently reflect the prevalence of OPLL and OLF in the general Korean population.
CONCLUSION
This is the first study to confirm the prevalence of OPLL and OLF in healthy Korean subjects. The results were consistent with those of previous studies on Koreans. The prevalence and distribution were consistent with those in other East Asians. The prevalence and number of lesions with spinal ligament ossification tended to increase with age. Ossification of the spinal ligament is likely to be seen across more than one level. If necessary, we recommended the use of whole-spine CT for differentiating other ossified lesions.
Notes
Conflict of Interest
The authors have nothing to disclose.
Funding/Support
This study received no specific grant from any funding agency in the public, commercial, or not-forprofit sectors.
Author Contribution
Conceptualization: YMK; Data curation: YHC, JHL; Formal analysis: YHC; Methodology: YMK; Visualization: YHC; Writing - original draft: YHC; Writing - review & editing: YHC, YMK