Multilevel Pedicle Subtraction Osteotomy for Correction of Thoracolumbar Kyphosis in Ankylosing Spondylitis: Clinical Effect and Biomechanical Evaluation
Article information

Abstract
Objective
To compare the clinical outcomes and biomechanical characteristics of 1-, 2-, and 3-level pedicle subtraction osteotomy (PSO), and establish selection criteria based on preoperative radiographic parameters.
Methods
Patients undergone PSO to treat ankylosing spondylitis from February 2009 to May 2019 in Sun Yat-sen Memorial Hospital of Sun Yat-sen University were enrolled. According to the quantity of osteotomy performed, the participants were divided into group A (1-level PSO, n = 24), group B (2-level PSO, n = 19), and group C (3-level PSO, n = 11). Clinical outcomes were assessed before surgery and at the final follow-up. Comparisons of the radiographic parameters and quality-of-life indicators were performed among and within these groups, and the selection criteria were established by regression. Finite element analysis was conducted to compare the biomechanical characteristics of the spine treated with different quantity of osteotomies under different working conditions.
Results
Three-level PSO improved the sagittal parameters more significantly, but resulted in longer operative time and greater blood loss (p < 0.05). Greater stress was found in the proximal screws and proximal junction area of the vertebra in the model simulating 1-level PSO. Larger stress of screws and vertebra was observed at the distal end in the model simulating 3-level PSO.
Conclusion
Multilevel PSO works better for larger deformity correction than single-level PSO by allowing greater sagittal parameter correction and obtaining a better distribution of stress in the hardware construct, although with longer operation time and greater blood loss. Three-level osteotomy is recommended for the patients with preoperative of global kyphosis > 85.95°, T1 pelvic angle > 62.3°, sagittal vertical alignment > 299.55 mm, and pelvic tilt+ chin-brow vertical angle > 109.6°.
INTRODUCTION
Ankylosing spondylitis (AS) is an autoimmune disease with a high disability rate, and mainly involves the sacroiliac joints and spine [1]. In the late stages of AS, the development of thoracolumbar kyphotic deformity seriously affects the life quality of the patients, and brings great burden both to the individual family and the social healthy career [2]. Three-column osteotomies are usually required to achieve adequate correction for the patients suffering from severe, rigid, and circular deformity [3,4]. Among various forms of 3-column osteotomies, pedicle subtraction osteotomy (PSO) is premium in restoring sagittal balance, reducing risk of blood vessel tears, and promoting fusion by enlarging the contact of osteotomy surfaces [5-7]. Previous studies revealed that multilevel PSO benefited in better curve correction, functionality restoration and pain relief comparing to single-level PSO, but the increased trauma led to additional risk of blood loss and postoperative weakness [8-11]. Overall, the application of multilevel PSO remains controversial.
In establishing a referring criterion for the quantity of osteotomy levels to be performed, a comprehensive consideration should be taken on radiological outcomes, postoperative quality of life, and biomechanical characteristics. Finite element analysis (FEA) is the most commonly used method in theoretical biomechanical studies. According to FEA techniques, the models are divided into simple and interacting elements, and the infinite unknowns of the real system are approximated using a finite number of unknowns [12]. Comparing to traditional experimental biomechanical methods, FEA is capable to calculate the overall and local distribution of stress under different loads, and provides the mechanical data of both external and internal structures [13-15]. Moreover, the models established are available for repeatedly different-dimension analysis, which provides convenience for further explorations. Recently, FEA has been applied to biomechanically analyze the spines of AS patients [16,17], yet current studies paid insufficient attention to the biomechanical characteristics of the spine performed with different levels of PSO.
In this study, we conducted a retrospective analysis on the clinical outcomes of the patients treated with PSO for AS-related kyphosis. Besides, a biomechanical analysis was performed based on an FEA model which simulated 1-level, 2-level, and 3-level PSO. The radiological parameters and quality-of-life indicators were compared among the patients undergoing different levels of osteotomies. The radiological criteria were established for the selection of multilevel PSO. The biomechanical characteristics of the internal fixation device, vertebrae and osteotomy plane were compared under various working conditions. Our research findings provide reference for the clinical application of multilevel PSO, and potentially help advance the surgical treatment of AS-related kyphotic deformity.
MATERIALS AND METHODS
1. Patients
Patients who underwent PSO in Sun Yat-sen Memorial Hospital of Sun Yat-sen University from February 2009 to May 2019 to treat thoracolumbar kyphosis (TK) secondary to AS were retrospectively enrolled in this study. The inclusion criteria were as follows: (1) the diagnosis of AS conformed to the diagnostic criteria revised in 1984 [18], (2) TK > 40° and lumbar lordosis (LL) < 10°, (3) coronal Cobb angle less than 10°, and (4) followed up for more than 1 year. The exclusion criteria included: (1) previous history of other spine-related diseases and operations, (2) accompanied with limited movement or ankylosis of hip and knee joints, and (3) incomplete data. After filtration, a total of 54 patients were included for data collection. According to the osteotomy levels to be performed, the participants were divided into 3 groups, as the group A of 1-level PSO (n = 24), group B of 2-level PSO (n = 19), and group C of 3-level PSO (n = 11).
2. Surgical Techniques
The required correction angle was determined as chin-brow vertical angle (CBVA) ± 10°. One-level osteotomy was performed when the required correction angle for kyphosis was within 30°, 2-level osteotomy was performed when the required correction angle for kyphosis was around 50°, and 3-level osteotomy was performed when the required correction angle for kyphosis was over 70° (Fig. 1). For 1-level PSO, the osteotomy site was set around the apex of the kyphotic deformity (mostly at L2). For multilevel PSO, the first osteotomy was mostly performed closely to the apex, the second osteotomy was performed at the L2–4 level, and the third osteotomy was chosen between the previously determined osteotomy levels. Routine PSO was operated under general anesthesia. Somatosensory evoked potential and motor evoked potential were monitored for neurosafety. Antibiotics were used postoperatively to prevent infection, and the patients were encouraged to exercise with brace at 1 week after surgery.
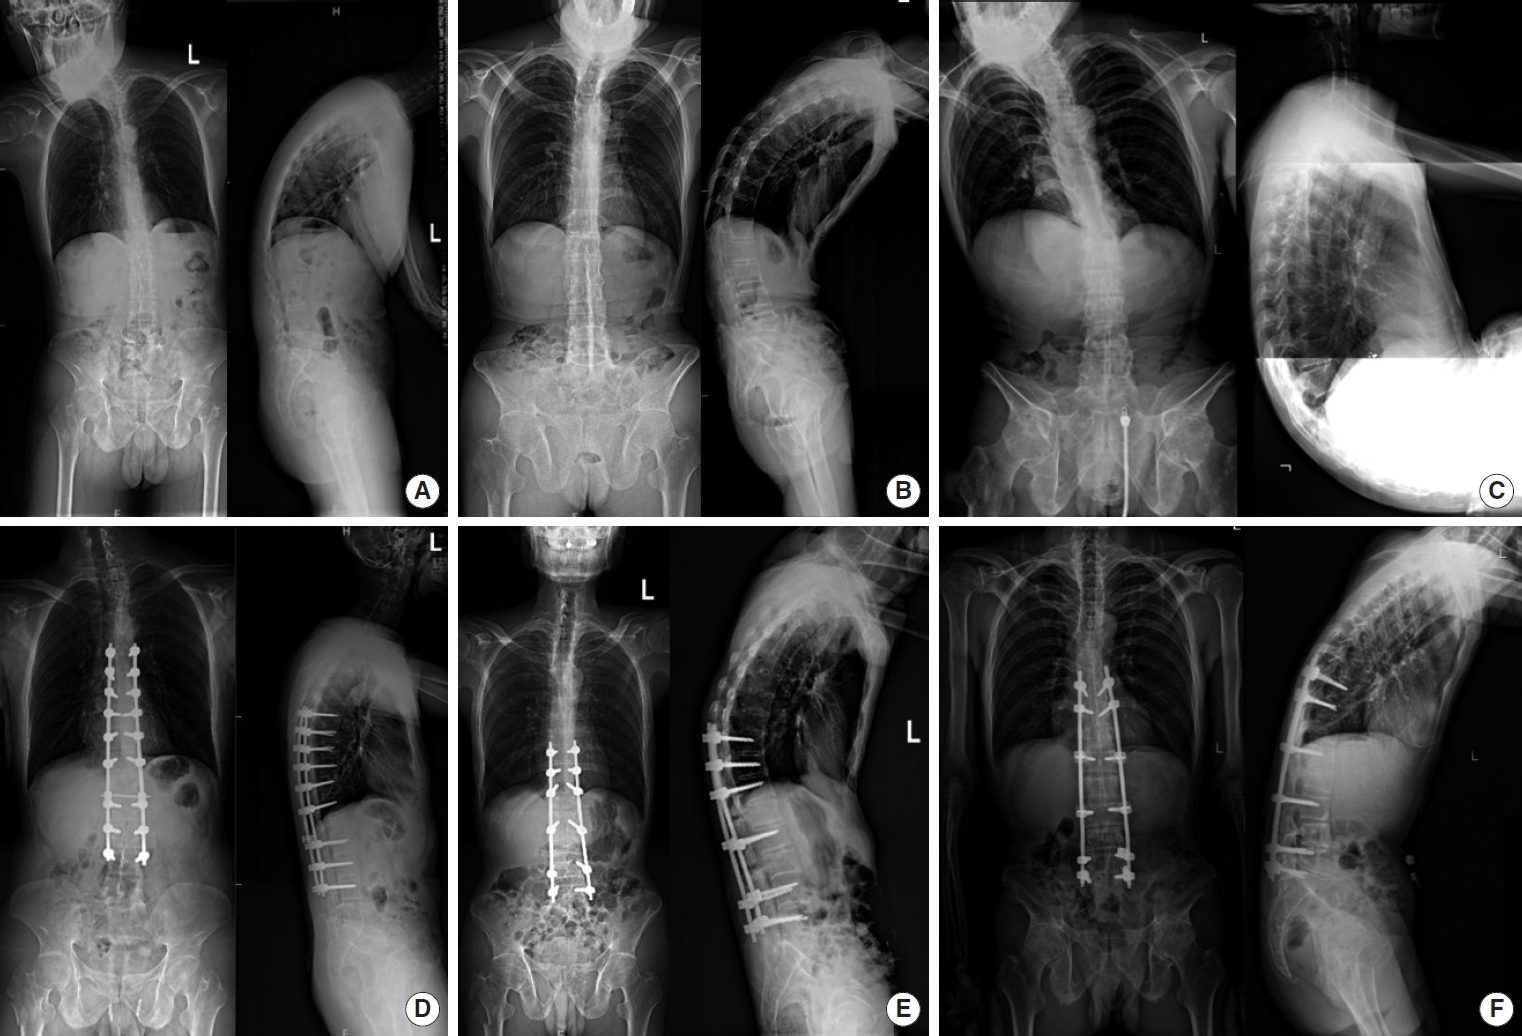
Representative radiographs for 1-level, 2-level, and 3-level PSO. (A-C) Preoperative spine radiographies in the anteriorposterior and lateral positions for the patients undergone 1- (A), 2- (B), and 3-level (C) PSO. (D-F) Spine radiographies in the anterior-posterior and lateral positions for the patients undergone 1- (D), 2- (E), and 3-level (F) PSO at the final follow-up.
3. Clinical Data Collection
General information and operative data were recorded, including age, sex, follow-up duration, operation time, intraoperative blood loss, and complications. Two specialized physicians assessed the radiographic parameters, and the average value was adopted for the final result. The parameters included CBVA, occiput-C2 angle (OC2), cervical lordosis angle (CL), C2–7 sagittal vertical alignment (cSVA), thoracic inlet angle (TIA), neck tilt angle (NT), T1 slope (T1S), global kyphosis (GK), TK, LL, pelvic incidence (PI), pelvic tilt (PT), sacral slope (SS), sagittal vertical axis (SVA), T1 pelvic angle (TPA), L1 pelvic angle (LPA), spinosacral angle (SSA), spinopelvic tilt (ST), and proximal junctional angle (PJA). The quality-of-life indicators included Bath Ankylosing Spondylitis Functional Index (BASFI), Ankylosing Spondylitis Quality of Life Scale (ASQoL), Jenkins Sleep Evaluation Questionnaire (JSEQ), Oswestry Disability Index (ODI), 36-item Short Form health survey (SF-36) physical composite score (PCS), and SF-36 mental composite score (MCS). The difference between the value at the last follow-up and the preoperative value was expressed with “Δ.” Particularly, ΔPJA was defined as the difference between the follow-up measurement and the postoperative value.
4. Establishment and Verification of FEA Model
As more than 70% of patients with AS have kyphotic apex between T10 and L2 [19], the FEA model was established based on the spine of an AS patient whose apex of kyphosis was located at T10. The modeled patient was a 30-year-old male of 165-cm height and 65-kg weight, and has been excluded of other spinal or spinal cord diseases by magnetic resonance imaging. The radiographic measurements of the patient were GK= 72.5°, TK= 57.4°, LL= 45.1°, and coronal Cobb angle= 0°. A whole-spine scan was performed using a 64-slice spiral computed tomography (CT) scanner (Siemens AG, Munich, Germany). The scanning slice thickness was set as 1 mm, and the reconstruction layer thickness was 0.5 mm. The DICOM files were exported and subsequently processed with Mimics 21.0 (MATERIALISE Inc., Leuven, Belgium), Geomagic Studio 2017 (3D Systems Inc., Rock Hill, SC, USA), and Ansys Workbench 17.0 software (ANSYS, Inc., Canonsburg, PA, USA). The properties of cortical bone, cancellous bone, facet joints, nucleus pulposus, annulus fibrosus, and ligaments were signed referring to previous studies [20-24]. The geometric model of the fixation device included pedicle screws with 6.5-mm diameter and 45-cm length, and rods with 5.5-mm diameter (Shanghai Sanyou, China). The rod was shaped to fit with the screws and contacted by binding mode [25].
In verification, the sacrum was constrained in all directions, and an axial load of 150N was applied on T4 vertebrae. Besides, a load of 7.5 Nm was applied in forward flexion, backward flexion, lateral bending, and rotating direction to simulate the spinal activities. The relative displacement and angular changes of the spine were calculated, and the results were compared with those reported in the previous study performed by Zhang et al. [16].
5. Biomechanical Analysis
In SolidWorks 2017, the procedure of 1-, 2-, and 3-level PSO was simulated using the validated model as described in Table 1. The displacement in x, y, and z axes was set to zero as the boundary condition. Referring to the average self-weight load of human body [26], the vertical load was set to 424.7 N. Loads of 10 Nm torque were applied to simulate the actions of forward flexation, lateral bending, and rotation. The distributions of the stress were measured under different working conditions, including the stress on the internal fixation instruments, osteotomy plane, and the superior endplate of each vertebra at the fixed area and the proximal junction area (upper instrumented vertebra and the 2 vertebrae above it).

Conduction of PSO FEA models
6. Statistics
Data conforming to normal distribution are presented as the mean ± standard deviation. The difference among groups was compared by 1-way analysis of variance, and LSD (least significant difference) t-test was used for post hoc comparison. Pearson analysis was used to evaluate the correlation. Nonnormally distributed data are presented as the median (interquartile range). Among-group comparisons were performed using the Wilcoxon symbolic rank sum test, and Kruskal-Wallis test was used for post hoc comparison. Spearman analysis was used to evaluate the correlation. The cutoff values of the radiographic parameters were determined by receiver operating characteristic (ROC) curve. Statistical analysis was performed using R software (3.6.3; IBM), and p < 0.05 was considered for statistical significance.
7. Ethics Approval
The studies involving human participants were reviewed and approved by the institute ethics committee of the Sun Yat-sen Memorial Hospital (SYSKY-2023-790-01). The patients/participants provided their written informed consent to participate in this study.
RESULTS
1. Baseline Characteristics
Fifty-four patients were enrolled in this study, comprising 39 males (72.2%) and 15 females (27.8%). The mean age was 39.19 ± 11.27 years old, and the average follow-up duration was 57.94 ± 33.81 months. Complications included 2 cases of dural tear (3.7%), 1 case of pneumonia (1.9%), 1 case of nerve injury (1.9%), 2 cases of nonunion (3.7%), and 2 cases of proximal junctional kyphosis (PJK) (3.7%). The baseline characteristics did not significantly differ among the 3 groups (p > 0.05), except that the operation time and intraoperative blood loss in group C were significantly higher than those in group A (p < 0.05) (Table 2).

Comparison of general data and operative outcomes
2. Radiographic Outcomes
Comparing the preoperative radiographic parameters of groups A, B, and C, significant differences were observed in cSVA, CBVA, NT, T1S, GK, TK, TPA, LPA, ST, SSA, SVA, and PT+CBVA (p < 0.05). At the final follow-up, statistically significant intergroup differences were observed in OC2, T1S, TK, SSA, SVA, PT, SS, PT+CBVA, and PJA (p < 0.05). TIA and PI did not significantly differ among the 3 groups, neither before surgery nor at the final follow-up (p > 0.05). The results of between-group comparisons are shown in Fig. 2. All radiographic measures at the final follow-up exhibited significant differences compared with preoperative measures (p < 0.05), except for OC2, CL, and PT in group A, OC2, CL, NT, LPA, and PT in group B, and LPA in group C (Supplementary Table 1). The differences of the parameters between the values at the last follow-up and the preoperative values were significantly different among groups (p < 0.05), except for △CL, △TIA, △LPA, △PI, and △TI-CL (Supplementary Table 2). The results of intergroup comparisons are shown in Fig. 3, showing that △PT, △PI–LL, and △LPA in group C were significantly larger than those of groups A and B.
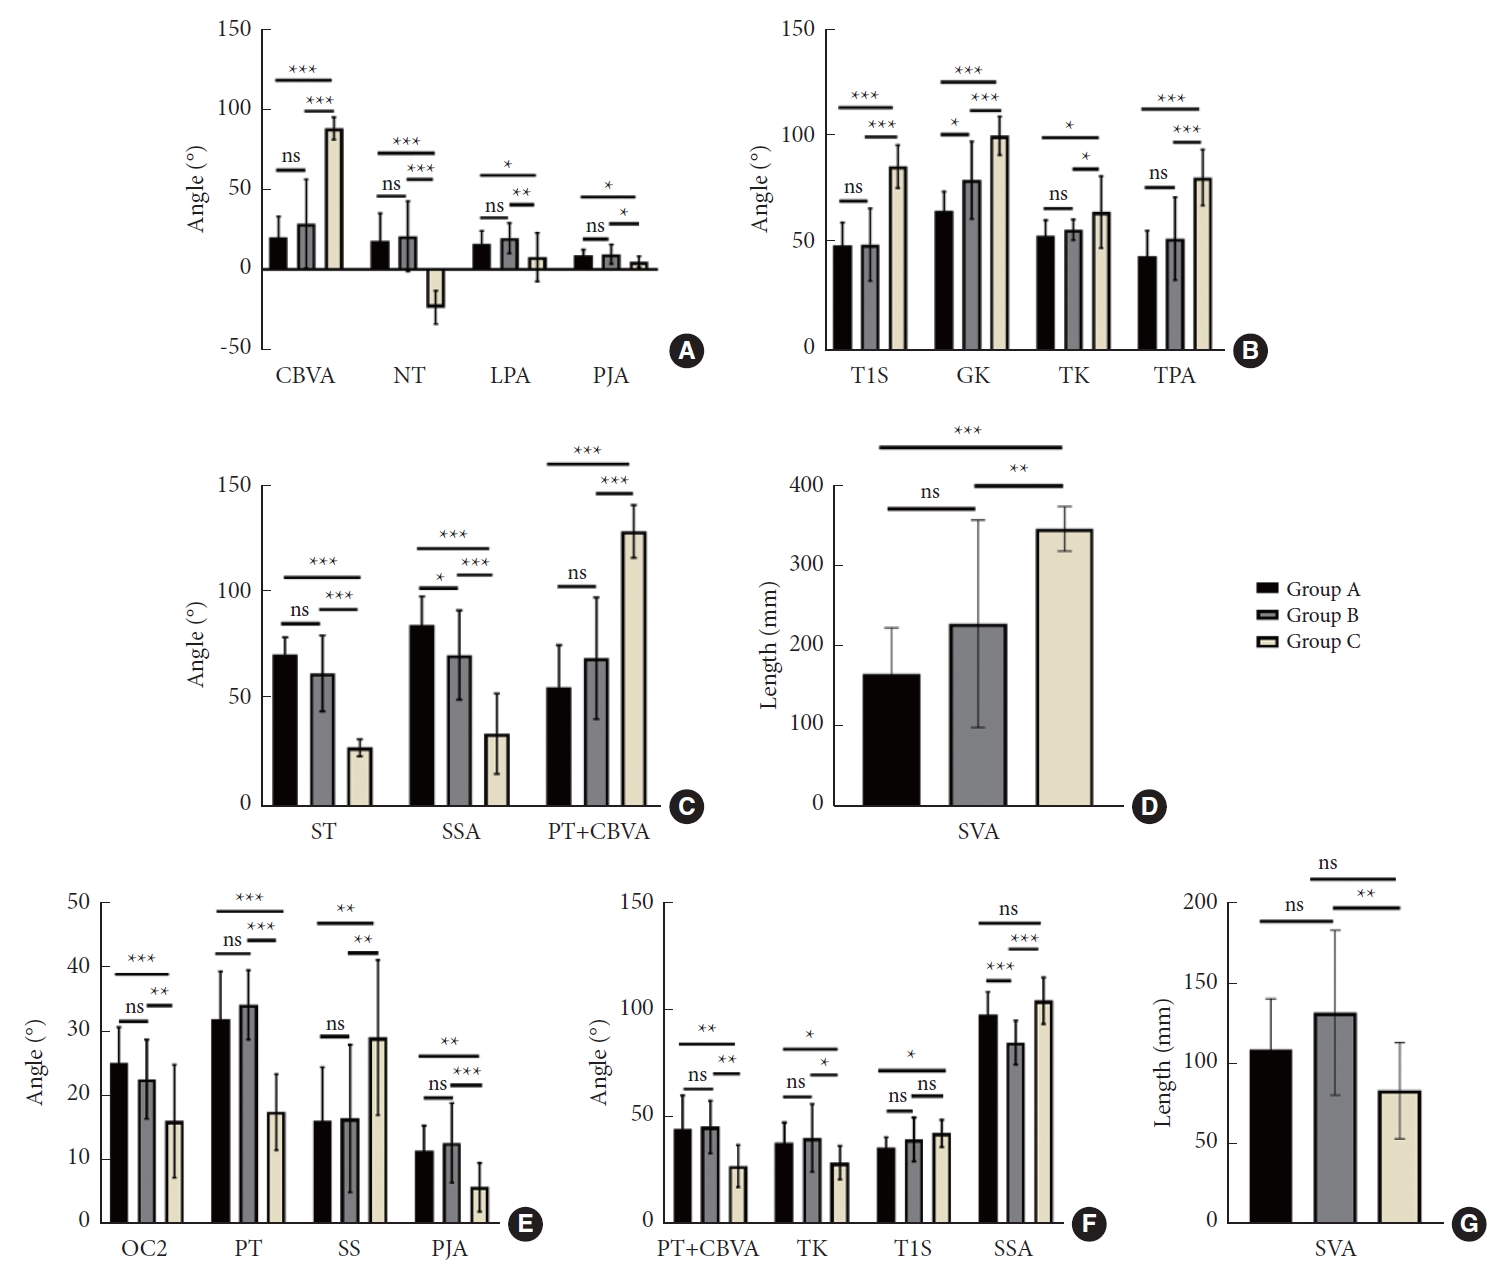
Intergroup comparison of radiographic parameters. (A-D) Comparison of preoperative radiographic parameters between groups. (E-G) Comparison of radiographic parameters between groups at the last follow-up. Group A, 1-level PSO; group B, 2-level PSO; group C, 3-level PSO; PSO, pedicle subtraction osteotomy; CBVA, chin-brow vertical angle; NT, neck tilt angle; LPA, L1 pelvic angle; PJA, proximal junctional angle; T1S, T1 slope; GK, global kyphosis; TK, thoracolumbar kyphosis; TPA, T1 pelvic angle; ST, spinopelvic tilt; SSA, spinosacral angle; PT, pelvic tilt; SVA, sagittal vertical axis; OC2, occiput-C2 angle; SS, sacral slope. *p<0.05, **p<0.01, ***p<0.001, ns represents p>0.05.
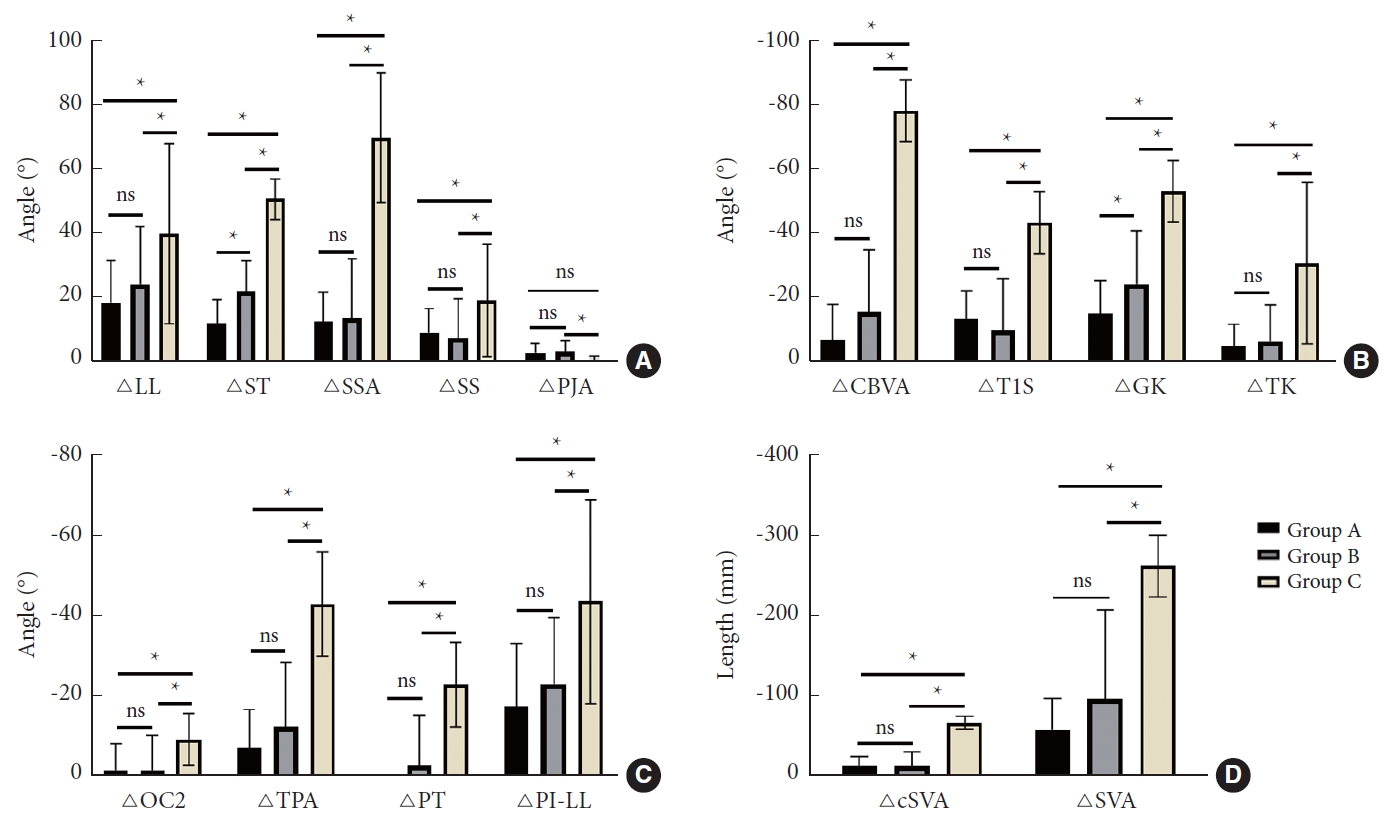
Intergroup comparison of differences of radiographic parameters preoperatively and at the last follow-up. Group A, 1-level PSO; group B, 2-level PSO; group C, 3-level PSO; PSO, pedicle subtraction osteotomy; LL, lumbar lordosis; ST, spinopelvic tilt; SSA, spinosacral angle; SS, sacral slope; PJA, proximal junctional angle; CBVA, chin-brow vertical angle; T1S, T1 slope; GK, global kyphosis; TK, thoracolumbar kyphosis; OC2, occiput-C2 angle; TPA, T1 pelvic angle; PT, pelvic tilt; PI, pelvic incidence; SVA, sagittal vertical alignment; cSVA, C2–7 sagittal vertical alignment. *p<0.05, ns represents p>0.05. Δ indicate the difference between the value at the last follow-up and the preoperative value.
3. Quality-of-Life Outcomes
All of the quality-of-life indicators were significantly improved at the final follow-up compared to preoperative values, both in the entire cohort and in each group (p < 0.001). The preoperative quality-of-life indicators were significantly different among the 3 groups (p < 0.001). Significant differences were observed in the quality-of-life indicators at the final follow-up among groups (p < 0.05), except for BASFI, ODI, and ASQoL (Supplementary Table 3). The differential values of quality-of-life indicators between the preoperative values and values at the final follow-up were significantly different among groups (Supplementary Table 4), and the improvements of quality-of-life indicators in group C were significantly larger than those of groups A and B (Fig. 4).
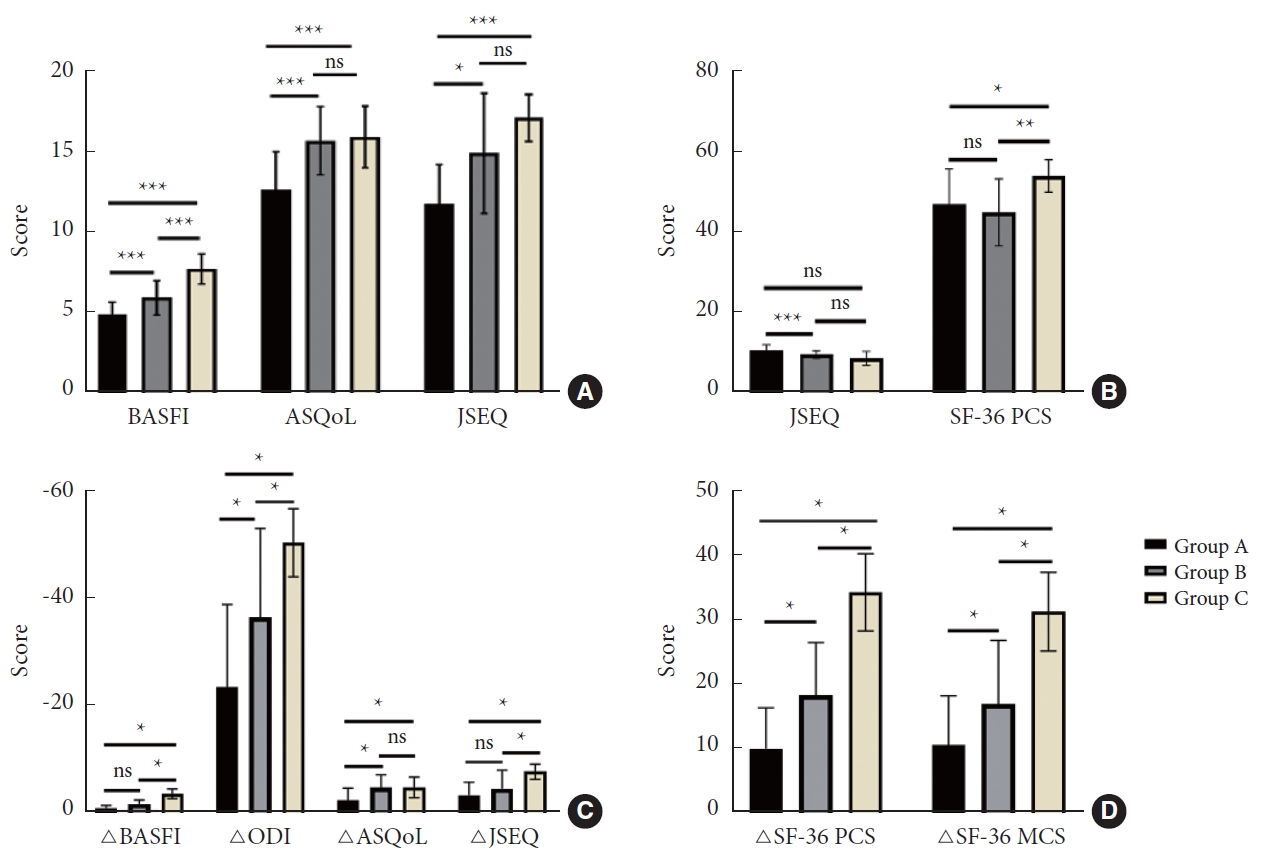
Intergroup comparison of life quality indicators. (A, B) Postoperative quality of life. (C, D) Differences of life quality indicators between preoperation and the last follow-up. Group A, 1-level PSO; group B, 2-level PSO; group C, 3-level PSO; PSO, pedicle subtraction osteotomy; BASFI, Bath Ankylosing Spondylitis Functional Index; ASQoL, Ankylosing Spondylitis Quality of Life Scale; JSEQ, Jenkins Sleep Evaluation Questionnaire; SF-36 PCS, 36-item Short Form health survey physical composite score; ODI, Oswestry Disability Index; MCS, mental composite score. *p<0.05, **p<0.01, ***p<0.001, ns represents p>0.05.
4. Biomechanical Outcomes
The 3-dimensional finite element model of the whole spine was successfully established based on the radiological data of the selected AS patient. Under the conditions of verification, the motive ranges of T5–L5 were 1.84° in forward flexion, 2.19° in backward flexion, 0.96° in left bending, and 0.56° in right bending. The spinal osteotomy models are shown in Fig. 5. The biomechanical characteristics of the models were quantified and compared under various working conditions (Supplementary Tables 5–7). Mostly, the screw stress in model A was significantly larger than that in the other 2 models (p < 0.05), and the screw stress in model B did not significantly differ from that in model C (p > 0.05) (Fig. 6). Under each working condition, the vertebra with the maximum equivalent stress was located at the proximal junction area in both models A and B, but that in model C was mostly located at the distal junction area (Fig. 7). For the stress on the proximal osteotomy plane, the largest value appeared in model C under vertical load (31.97 Mpa), and in model A under other conditions (range, 52.15–83.38 Mpa). The stress on the titanium rod was the largest in model A under all of the working conditions (range, 1,141.30–1,211.70 Mpa). The average stress on the upper endplate of the vertebrae in the fixed area did not significantly differ among the 3 models (p > 0.05) (Fig. 8).
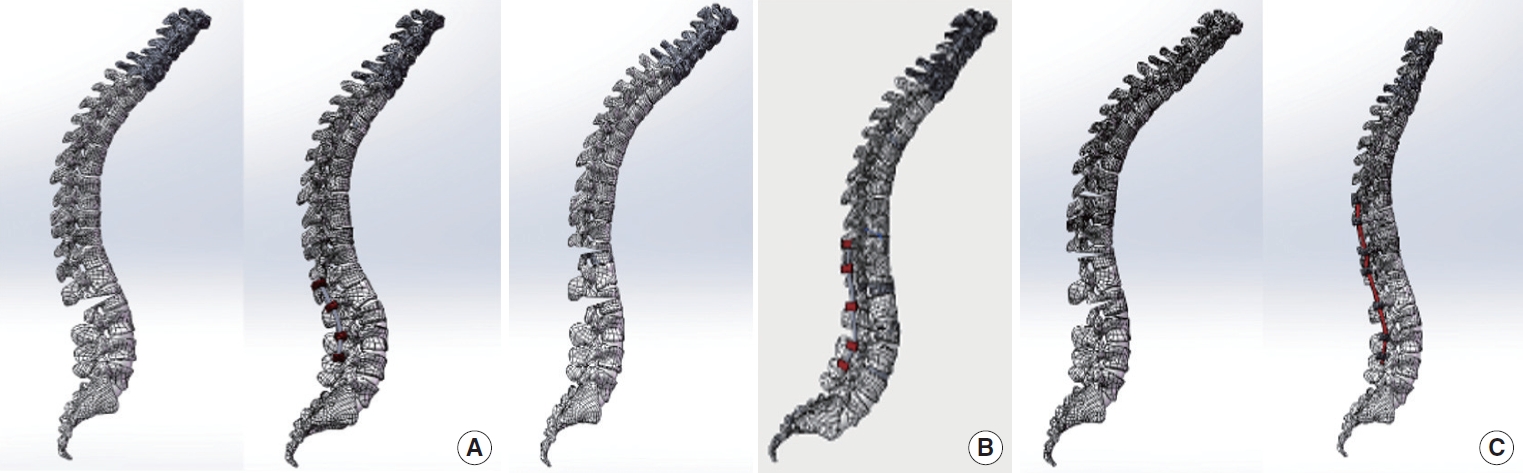
Three-dimensional finite element models of spinal osteotomy. (A) Model A simulating 1-level PSO, including 644825 nodes and 340921 elements. (B) Model B simulating 2-level PSO, including 673033 nodes and 353384 elements. (C) Model C simulating 3-level PSO, including 716351 nodes and 376757 elements.
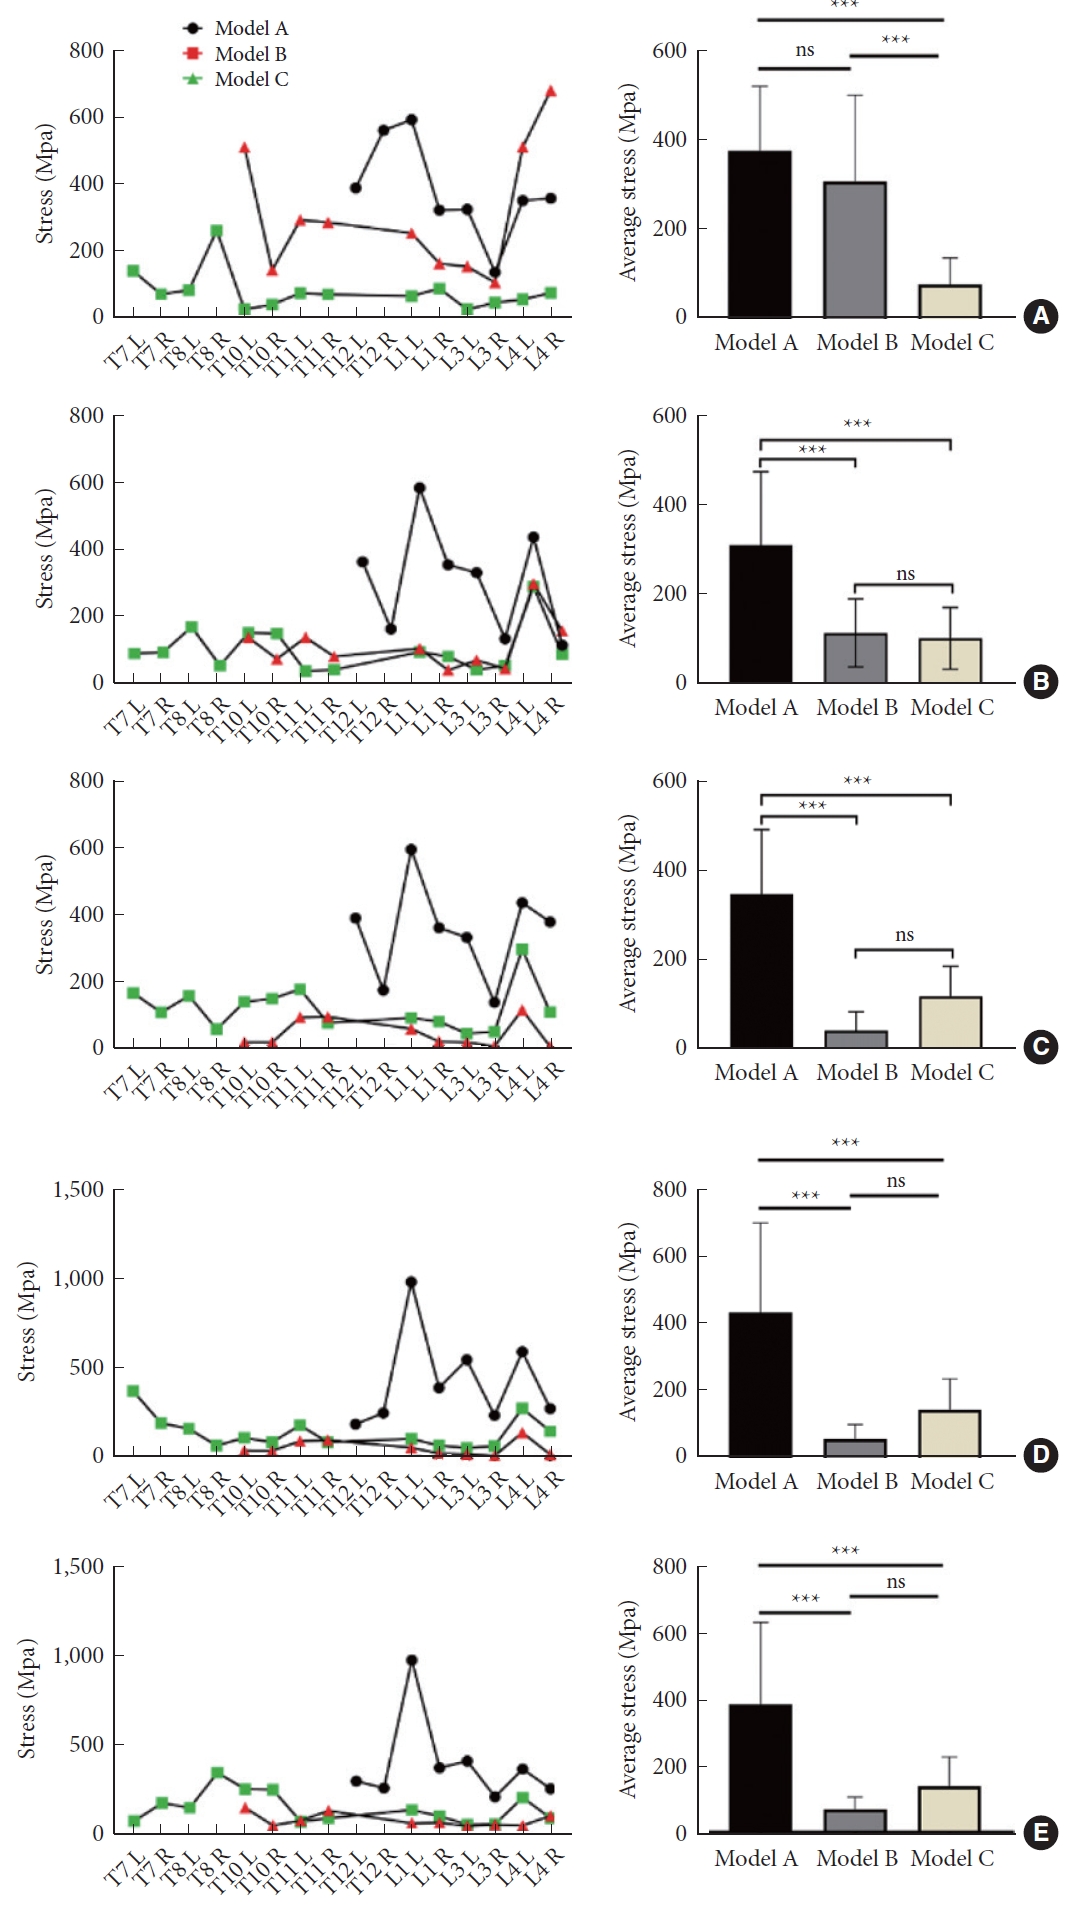
Comparison of equivalent and average screw stress. (A) Under vertical load. (B) Under forward flexion load. (C) Under backward flexion load. (D) Under lateral flexion load. (E) Under rotating load. ***p<0.001, ns represents p>0.05.

Equivalent stress of vertebrae. (A) Under vertical load. (B) Under forward flexion load. (C) Under backward flexion load. (D) Under lateral flexion load. (E) Under rotating load.
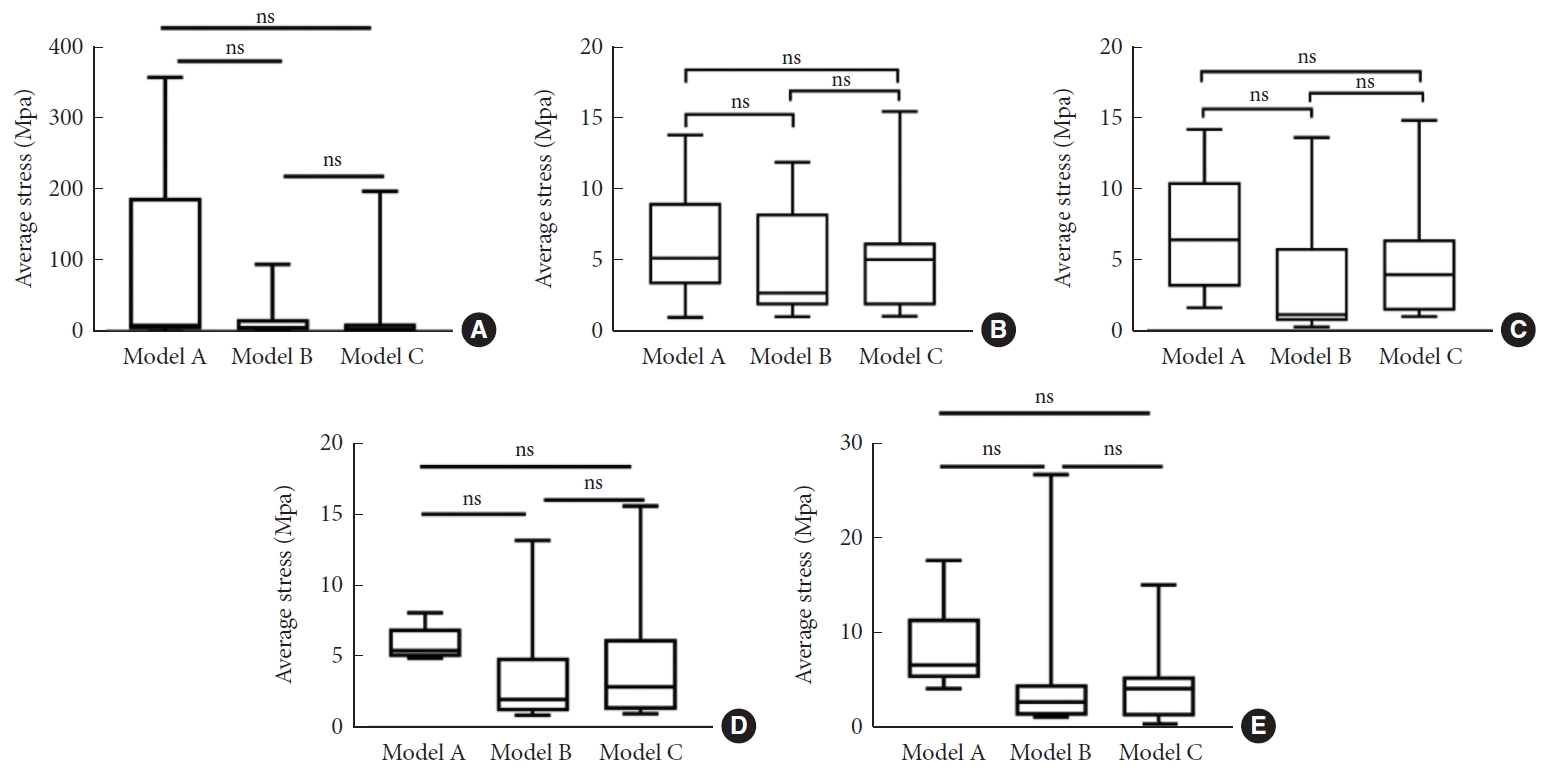
Average stress of the upper endplate of the vertebrae in the fixed area. (A) Under vertical load. (B) Under forward flexion load. (C) Under backward flexion load. (D) Under lateral flexion load. (E) Under rotating load. ns represents p>0.05.
5. Radiological Criteria for Multilevel PSO
The preoperative GK, TPA, CBVA, SVA, cSVA, ST, SSA, and PT+CBVA exhibited significant correlations with the quantity of osteotomy performed (p < 0.001) (Table 3). ROC curve analysis was used to determine the cutoff values for the significantly correlated parameters (Fig. 9). Finally, GK< 71.95°, TPA< 56.8°, SVA < 226.9 mm, and PT+CBVA < 84.9° were determined as the selection criteria for 1-level PSO, and GK> 85.95°, TPA> 62.3°, SVA > 299.55 mm, and PT+CBVA > 109.6° were determined as the selection criteria for 3-level PSO (Supplementary Table 8).

Preoperative radiographic parameters and quality-of-life indicators correlated to osteotomy number selection
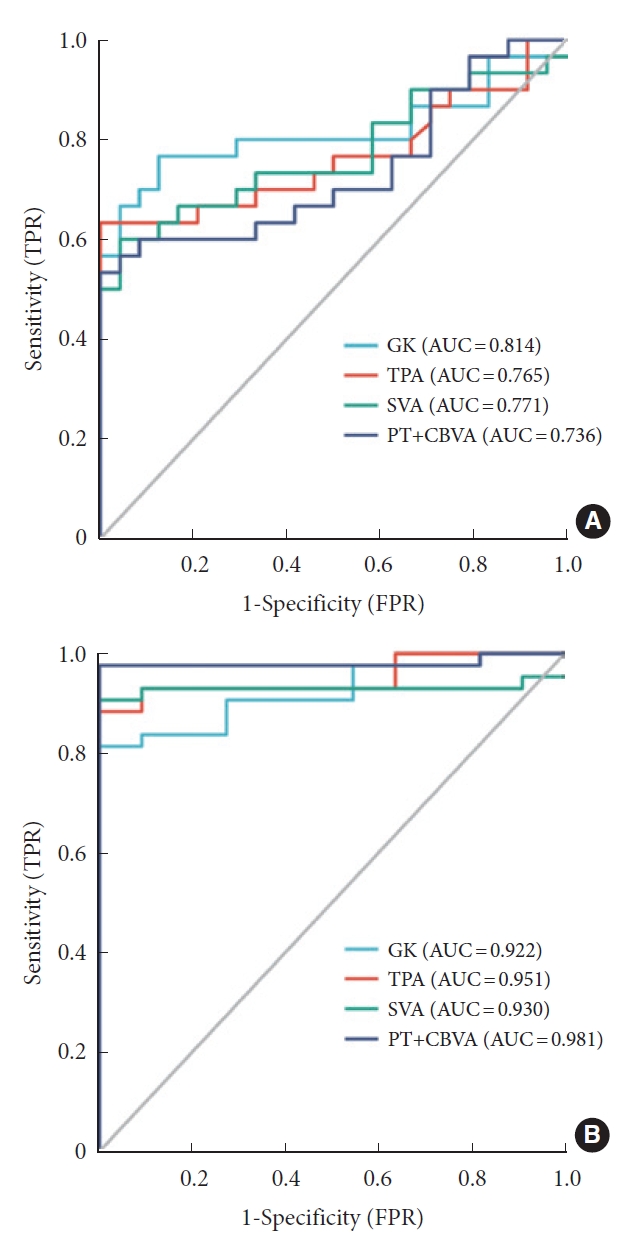
Receiver operating characteristic curve determines the cutoff value of radiographic parameters. (A) Single-level osteotomy. (B) Three-level osteotomy. AUC, area under the curve; TPR, true positive rate; GK, global kyphosis; TPA, T1 pelvic angle; SVA, sagittal vertical axis; PT, pelvic tilt; CBVA, chinbrow vertical angle; FPR, false positive rate.
DISCUSSION
The rigid kyphotic deformity at the late stage of AS severely restricts the daily activities of the patients. Thus, 3-column osteotomy is commonly required for adequate correction. When determining the surgical design of 3-column osteotomy, the risk and benefit of increasing osteotomy count is always a controversial issue for surgeons. Therefore, the clinical outcomes of 1-, 2-, and 3-level PSO were firstly compared in this study. All of the life-of-quality indicators were significantly improved after operation in all of the groups, and 3-level PSO was premium in improving JSEQ, SF-36 PCS and SF-36 MCS. Similar to that reported by Qian et al. [27], the total complication rate in this study was 14.8%, and there was no statistical difference among the 3 groups. Overall, multilevel osteotomy is a safe and effective method to treat the kyphotic deformity secondary to AS.
Previous research indicated that the PT and CL could be partially corrected after thoracolumbar osteotomy [28,29], aligning with our findings in group C but conflicting with the results in groups A and B. Similarly, while a significant improvement of TPA was obtained by 3-level PSO at the final follow-up, identical result was not found in groups A and B. PI–LL was significantly improved in all of the 3 groups, and the ΔPI–LL of group C was significantly larger than that of groups A and B. Such outcomes were probably due to the higher severity of deformity in group C comparing to the other 2 groups. Additionally, the better correction achieved by multilevel PSO might be more beneficial for the compensation of cervical and pelvic parameters, which facilitates better sagittal spinal reconstruction for the patients with AS-related kyphosis. The improvement of LPA was only observed in group A, as the dispersed osteotomy angle by thoracic osteotomy in multilevel PSO relatively reduces the corrective angle in the lumbar spine. A consideration-provoking problem is that single-level spinal osteotomy requires enlarged degree of osteotomy for sufficient correction, but such procedure leads to increased local trauma and decreased stability. In this way, the surgical safety might be challenged by the possibility of osteotomy-surface slippage after operation.
The biomechanical characteristics of the spine after osteotomy are directly related to the stability of the internal fixation, as well as determine the prognosis of the patients. In this study, a finite element model of the spine was established based on the CT data of an AS patient. In comparison with the FEA models reported in previous literature [16], the model was largely in line with the pathological characteristics of the spine with AS. Biomechanical analysis illustrated that the instrumented segments were prolonged with the increase of the osteotomy count, and the screw stress was dispersed by the increase of pedicle screws. While the screw stress was mainly concentrated around the osteotomy plane in single-level PSO, the maximum screw stress of multilevel PSO was transferred to the distal instrumented area. The maximum vertebra stress of models A and B was located at the facet joint of the upper instrumented vertebra, but that of model C was located at the distal junction. Increased stress on the internal fixation and the vertebra has been recognized as a main risk factor of junctional kyphosis [30,31]. Therefore, significant emphasis is warranted on the risk of PJK in patients performed 1-level PSO, and the risk of distal junctional kyphosis in AS patients undergone 3-level PSO. To reduce the risks, special attention should be paid on the selection of the osteotomy site and the lowest instrumented vertebra [32].
The osteotomy healing greatly depends on the stress of the osteotomy plane. In this study, the largest stress of the proximal osteotomy plane appeared under rotation in models A and C, and appeared under vertical compression in model B. Under most of the working conditions, the stress of the proximal osteotomy plane in models A and C was much larger than that in model B. The rod stress in model A was much higher than that in models B and C. Besides, the maximum rod stress in model A mainly concentrated on the junction of the rod with screw, but relatively large rod stress was distributed around the osteotomy area in models B and C. Comprehensively considering the biomechanical characteristics of the osteotomy plane and the rod, the stress was mainly transmitted through the osteotomy plane in 1-level osteotomy, and was dispersed by the instrumentations in multilevel osteotomy. Additionally, taking the weak mechanical stability of osteotomy plane in 1-level and 3-level PSO, excessive lateral flexion and rotation should be limited for the patients after surgery.
Learning from our clinical and biomechanical outcomes, multilevel PSO allows greater sagittal parameter correction for severe deformity, and obtains better distribution of stress in the hardware construct comparing to single-level PSO. However, previous studies have demonstrated that multilevel osteotomy leads to the increase of intraoperative bleeding and operation time [33,34], in consistence with our results. The average intraoperative blood loss of the patients in group C was 1,721.36 mL, and the average operation time was 410.73 minutes, both higher than the values in group A. Therefore, we further investigated the optimal surgical design for the patients suffering from AS with TK. PT+CBVA was taken as an independent parameter for the combined concern on horizontal gaze and pelvic compensation. Our findings recommended 1-level PSO for AS patients with the preoperative radiographic parameters of GK< 71.95°, TPA< 56.8°, SVA< 226.9 mm, and PT+CBVA< 84.9°, and 3-level PSO for those with GK> 85.95°, TPA> 62.3°, SVA> 299.55 mm, and PT+CBVA> 109.6°. Two-level osteotomy was suggested to be performed when the preoperative parameters are in between the two. Previous studies have reported that satisfactory outcomes were obtained by 1-level osteotomy for the patients with preoperative GK of 55.8°–74.9°, SVA of 147–196.7 mm, TKA of 44°–51°, and PT+CBVA of 90°, and by 2-level osteotomy for the patients preoperative GK of 82.6°, PT+CBVA of 107.9°, and SVA of 241–294 mm [8,35-37]. The radiographic reference conducted in this study provide a more specific range, and supplement the criteria for the selection of 3-level PSO.
There are certain limitations in this study. The acquisition of the clinical outcomes relied on retrospective data collection and self-reported quality of life scores, which introduced potential bias. Moreover, the sample size was limited by the morbidity of AS-related kyphosis and the willing of the patients to accept a major surgery, which had a potential impact on the statistical accuracy. For biomechanical evaluation, the FEA model was based on the skeletal system of an AS patient with kyphosis of apex at T10. The effect of soft tissues was neglected, and the model may not hold for patients with an apex elsewhere in the thoracic spine. More exquisite FEA models are encouraged to deeply understand the biomechanical characteristics of the spine performed with multilevel PSO to treat kyphotic deformity secondary to AS. Additionally, the radiographic criterion raised in our study deserves further validation by multicenter and large-scale research, and the technical details should be discussed such as the optimal osteotomy sites.
CONCLUSION
Multilevel PSO works better for larger deformity correction than single-level PSO by allowing greater sagittal parameter correction and obtaining a better distribution of stress in the hardware construct, although with longer operation time and greater intraoperative blood loss. Three-level osteotomy is recommended for the patients with preoperative of GK> 85.95°, TPA> 62.3°, SVA> 299.55 mm, and PT+CBVA> 109.6°.
Supplementary Material
Supplementary Tables 1-8 can be found via https://doi.org/10.14245/ns.2347118.559.
Intra-group comparison of radiological parameters
Inter-group comparison of the radiographic parameter differences
Inter-group comparison of quality of life indicators
Inter-group comparison of the differences of life quality indicators
Biomechanical characteristics of Model A under various working conditions
Biomechanical characteristics of Model B under various working conditions
Biomechanical characteristics of Model C under various working conditions
Cut-off values of radiographic parameters that determine the number of osteotomies selected
Notes
Conflict of Interest
The authors have nothing to disclose.
Funding/Support
The study was supported by the Medical Scientific Research Foundation of Guangdong Province of China (A2021044 and A2021371), the Guangzhou Municipal Science and Technology Bureau (202102020096), the Basic and Applied Basic Research Foundation of Guangdong Province (2021A1515111216), and the Guangzhou Science and Technology Planning Project (202201011042).
Author Contribution
Conceptualization: YN, QW, DZ, XH, ZH, QZ; Data curation: XL, YN, ZZeng, RH, WL; Formal analysis: ZZeng, RH; Funding acquisition: LG; Methodology: YN, QW, XH, ZH, ZZhang; Project administration: DZ, WL, LG; Visualization: XL, QW, JL; Writing - original draft: XL, DZ, JL; Writing - review & editing: QZ, ZZhang, LG.