Variation of C-Reactive Protein and White Blood Cell Counts in Spinal Operation: Primary Fusion Surgery Versus Revision Fusion Surgery
Article information
Abstract
Objective
Serum C-reactive protein (CRP) concentrations and white blood cell (WBC) count are commonly used to identify postoperative wound infections. We investigated whether changes in serum CRP levels and WBC counts actually differed between patients undergoing revision spinal fusion surgery and those undergoing a primary fusion.
Methods
Patients who underwent posterolateral fusion (PLF) surgery at Pusan National University Yangsan Hospital between October 2013 and April 2015 were considered for this study. Sixty-seven patients with primary lumbar PLF (pPLF) and 21 with revision PLF (rPLF) were enrolled. A retrospective assessment of preoperative and postoperative CRP levels and WBC count was undertaken. Also, we gathered peak CRP day, and CRP normalization days. Comorbidity data were also obtained to evaluate any effects on the course of CRP and WBC count postoperatively.
Results
CRP levels peaked at 3 days after surgery. The maximum CRP values recorded for each group: 4.17 (standard deviation [SD], 4.18) mg/dL and 4.88 (SD, 3.03) mg/dL for pPLF and rPLF. This difference was not statistically significant (p=0.24). A rapid fall in CRP within 5–9 days was observed for both groups.
Conclusion
Out of our expectation, changes in CRP levels after spinal fusion surgery follow the same course regardless of whether it is a revision operation or not. Because of this result, both the primary PLF surgery and revision PLF surgery should be monitored using CRP in the similar way and the antibiotic administration should be determined.
INTRODUCTION
Spine fusion surgery using instruments is still a useful technique for treating degenerative spine disease or spine trauma. When performing instrument-applied spine surgery for degenerative diseases the complications associated with postoperative infection are problematic for both neurosurgeons and patients. The surgical wound infection rate varies with the type of surgery and other patient factors. For instance, the rate of infection is 0.7% for a simple intervertebral disc removal but between 3.2% and 4.2% for fusion using instruments7,10,13). Many laboratory tests are performed to deal with postoperative infection and enable early detection of infection. Measurement of serum C-reactive protein (CRP) levels and white blood cell (WBC) count are 2 basic blood exams used to identify potential infections after a surgical procedure. CRP is a useful parameter for detecting acute phase infection or systemic inflammatory response4,6,8,11); however, monitoring changes in CRP values postoperatively is also useful for identifying a potential infection relapse or evaluating the effectiveness of treatment1,4). Measurement of the natural CRP progression induced by a fusion operation is helpful for detection of postoperative infections. And there is the study showing that revision fusion cases have a higher rate of postoperative infection when compared to primary fusion cases9). These infections are generally related to the devascularization of previous wounds which can impede postoperative wound healing and may predispose the patient to wound infection2). Taking this into consideration, we supposed that the inflammatory response observed in revision spine surgery would be dissimilar from primary surgery cases. Since there was no data available for changes in CRP levels following a revision spine fusion operation, herein we investigated the natural course of changes in CRP and WBC count and compared these results with those obtained from the first operation group whether there are actual differences between the 2 groups.
MATERIALS AND METHODS
1. Patients
We reviewed 187 patients who underwent posterolateral fusion (PLF) at Pusan National University Yangsan Hospital from October 2013 to April 2015. Only single level fusion cases aimed to treat degenerative disease such as spondylolisthesis and spinal stenosis were enrolled. Fusion procedures intended to treat infection (n=22), cancer metastasis (n=8), hepatitis (n=12), trauma (n=37), postoperative hematoma (n=2), hematologic disorder (n=9), tumor (n=4), and postoperative infection (n=5) were excluded. Of the 88 patients enrolled, 67 patients were included in the primary lumbar PLF (pPLF) group and 21 were included in the revision PLF (rPLF) group. We carried out a retrospective assessment of preoperative and postoperative CRP levels and WBC count. Confounding factors such as body mass index (BMI), American Society of Anesthesiologists (ASA) physical status classification, arterial hypertension, diabetes mellitus, and perioperative antibiotics usage were recorded to evaluate their effects on CRP values and WBC count postoperatively. Postoperative infection cases (n=5) were recorded separately to compare CRP & WBC value courses with noninfectious cases. All patients agreed to written informed consent about complications of spinal fusion surgery
2. Surgical Procedures
All operations were performed under general anesthesia. Perioperative antibiotics (cefazolin 1 g) was administered by intravenous injection within 1 hour of making the first skin incision and was continued every 8 hours for 3 days postoperatively in all enrolled cases. We did not observe any allergic reaction to this medication in our patient group.
The surgical procedure was performed using the PLF technique. After spinal canal decompression, 4 transpedicular screws (CD Horizon Legacy System; Medtronic, Minneapolis, MN, USA) were inserted under C-arm fluoroscope guidance. The autologous bone graft, hydroxyapatite and demineralized bone matrix were applied after the rods were firmly fixed to the screw.
3. Laboratory Tests
All preoperative blood samples were acquired the day before surgery and additional postoperative specimens were taken on days 3, 6, and 9 after surgery at approximately the same time each day (7 AM). Serum CRP levels were quantified on an AU5800 analyzer using a high-sensitivity CRP method with heterogeneous immunoassay (Beckman Coulter’s AU chemistry, Indianapolis, IN, USA). WBC count was calculated using the Sysmex HST N302 XE (Sysmex Corp., Tokyo, Japan). Normal CRP value was set to less than 0.5 mg/dL, and less than 12×109/μL for normal WBC count
4. Statistics
Age, BMI, surgery time, peak values of the inflammatory parameters are given as mean values with the SD. The differences in confounding factors between the 2 procedures, with regards to CRP levels and WBC count, were evaluated using the Wilcoxon rank-sum test. Categorical values were offered in relative frequencies and the diversity between the groups was tested using the chi-square test or the Fisher exact test when the expected frequencies were less than 5. Kruskal-Walis test was performed to evaluate longitudinal differences in each group. To estimate the effect of the procedures on the peak values of CRP levels with adjustment for the potential confounding factors a multiple linear regression model was applied. Statistically significant factors (p<0.05) were included in the model in the multivariate analyses in addition to the baseline values. All statistical analyses were performed using IBM SPSS Statistics ver. 21.0 (IBM Co., Armonk, NY, USA).
RESULTS
1. Patients and CRP Kinetics
A total of 88 patients met the inclusion criteria and were included in the study. A summary of patient demographics, comorbidities and ASA physical status classification was shown in Table 1. The mean preoperative CRP levels for both surgical groups were within the normal range (0.18 [SD, 0.30] mg/dL, n=67, for the primary fusion group and 0.13 [SD, 0.17] mg/dL, n=21, for the revision group). A similar pattern of CRP response was observed in the postoperative period regardless of the procedure undertaken with peak values observed at postoperative day (POD) 3 (Fig. 1). After pPLF operations, CRP values increased up to 4.17 (SD, 4.18) mg/dL, and showed statistically significant difference from preoperative CRP value (p=0.002). The increase observed following rPLF procedures was up to 4.88 (SD, 3.03) mg/dL, also demonstrates statistically significant difference from preoperative CRP value (p<0.001). Both group’s elevated CRP values did not show statistically significant differences between each other (p=0.24). After POD 3, CRP values for both primary and revision procedures decreased rapidly in all patients. At POD 6 the mean CRP was 1.59 (SD, 1.45) mg/dL after pPLF and 2.13 (SD, 2.03) mg/dL after rPLF. At POD 9 the mean CRP was 1.27 (SD, 2.66) mg/dL for pPLF patients and 0.86 (SD, 0.58) mg/dL for rPLF patients. Normalization days in pPLF was 9.68 (SD, 7.12) days, 10.61 (SD, 3.36) days for rPLF patients. There were no significant statistical differences between the 2 groups (p=0.26). Both pPLF and rPLF cases showed longitudinal difference in CRP values (p<0.001, for both pPLF and rPLF) (Table 2).
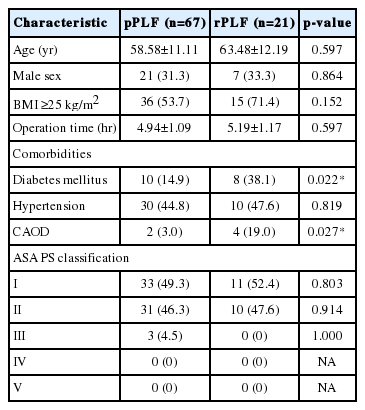
General patient characteristics (n=88), medical history, and comorbidities (n=88)

Kinetics of postoperative C-reactive protein (CRP) levels (mg/dL); primary fusion operation (pPLF) vs. revision fusion operation (rPLF). Values are mean and standard error. Pre-OP, preoperation; POD, postoperative day.
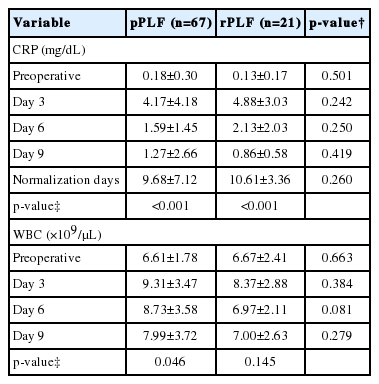
Mean values of preoperative and postoperative CRP and leukocyte profiles
2. WBC Count Kinetics
The preoperative values for WBC count were similar and within the normal range for both patient groups (6.61[SD, 1.78]×109/μL for pPLF, 6.67 [SD, 2.41]×109/μL for rPLF). Both groups showed a peak level of WBC count at POD 3 (Fig. 2) but there was no statistical significance between the 2 procedures. In primary cases, there is the longitudinal difference in WBC counts (p=0.046). But in cases of revision procedure, there is no statistically significant longitudinal differences (p=0.145) (Table 2).
Kinetics of postoperative white blood cell (WBC) counts (×109/μL); primary fusion operation (pPLF) vs. revision fusion operation (rPLF). Values are mean and standard error. Pre-OP, preoperation; POD, postoperative day.
3. Influence of Comorbidities and Surgery Time
Using multiple regression analysis, we assessed whether there might be any correlation between peak CRP value and comorbidities (Table 3). Hypertension, coronary artery obstructive disease, and surgical duration had no influence on CRP kinetics postoperatively. ASA physical status classification was not found to affect peak postoperative CRP values. Diabetes mellitus did however have a statistically significant influence on peak CRP values (p=0.012) but obesity showed no relationship.
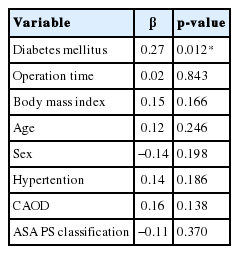
Multiple regression analysis of peak values of CRP profiles for all patients
4. Course of Infection Patients’ Cases
Details of CRP and WBC values of infection patients’ cases are displayed in Table 4. Of our postoperative infection cases, 5 received antibiotics intended to treat a postoperative wound infection (primary operation, n=2; revision operation, n=3). Of these 5 cases, patient number 2 showed persistent CRP elevation, patient numbers 1, 3, 4, 5 displayed an interrupted decline, and all patients exhibited a prolonged period of normalization (>20 days) (Fig. 3). In WBC counts, primary operation-infection patients showed elevated WBC counts above normal range, while revision operation-infection patients’ WBC counts were mostly within normal range (Fig. 4).
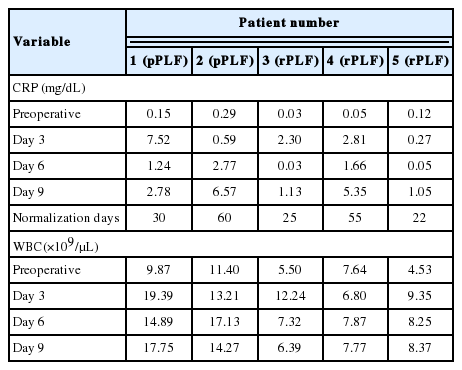
CRP and WBC course of infection complications
C-reactive protein (CRP) profiles of infection complication cases (mg/dL); infection patient (PT) numbers 1 and 2 had primary fusion surgery. Infection PT numbers 3, 4, and 5 had revision fusion surgery.

White blood cell (WBC) profiles of infection complication cases (×109/μL); infection patient (PT) numbers 1 and 2 had primary fusion surgery. Infection PT numbers 3, 4, and 5 had revision fusion surgery.
DISCUSSION
Herein we report that regardless of the procedure performed peak CRP levels are observed on POD 3 and are followed by a rapid decrease between POD 6 and 9 (Fig. 1). Previous studies have also reported that the maximum CRP level appears on POD 2 and in the absence of any postoperative infection this elevation is followed by a rapid decline1,3,6,8). Different types of surgery on different regions of the body parts result in different peak CRP values6,8). This variation is believed to be caused by variation in iatrogenic tissue damage during surgery on different tissue types. Notably, in our study, the trend in postoperative CRP response showed no significant difference (Table 1, Fig. 1). Mok et al.5) reported that in noninfectious cases the changes observed in CRP levels following different surgical procedures appear to follow a similar pattern regardless of the operation or region. Comparison with infection cases, if the rapid decrease that we expect to see in CRP at POD 4–7 days is interrupted or values continue to rise, infectious complications should be considered3,4,12).
In our study, we did not see any significant correlation between the observed changes in peak CRP level and patient medication, prior spinal surgery, or common comorbidities except for diabetes mellitus. Statistically significant difference was shown in the proportion of diabetic patients between the pPLF and rPLF patient groups (Table 1). Because WBC counts did not show significant longitudinal difference in rPLF, we conclude that CRP is a more sensitive parameter for the early detection of infectious complications than WBC count. A combination of erythrocyte sedimentation rate, body temperature, and CRP levels is useful for the interpretation of infectious complication in spinal fusion operations11). However, a large prospective randomized trial is necessary to confirm if serial monitoring of CRP is enough for early detection of infectious complications after spinal surgery.
CONCLUSION
We found that CRP value course, CRP normalization days, peak CRP day and peak CRP values after spinal fusion surgery are similar regardless of primary or revision surgery. Because of this result, we recommend both the primary spinal fusion surgery and revision spinal fusion surgery should be monitored using CRP in similar way and the antibiotics administration should be determined.
Notes
CONFLICT OF INTEREST
No potential conflict of interest relevant to this article was reported.