Anatomical Importance Between Neural Structure and Bony Landmark: Clinical Importance for Posterior Endoscopic Cervical Foraminotomy
Article information
Abstract
Objective
Posterior endoscopic cervical foraminotomy (PECF) is a well-established, minimally invasive surgery for cervical radiculopathy, but have the more chances of neural structure damage due to the limited visibility and steeper learning curve. So, the anatomical understanding of the nerve associated with the bony structure will be an essential surgical guideline.
Methods
We measured the distance between the bilateral dura lateral edge and bilateral V-point on axial cuts of cervical magnetic resonance imaging and 3-dimensional spine computed tomography imaging, respectively, from 80 patients. We then calculate the distance and position between the dura lateral edge and the V-point as surgically critical width (SCW). Transverse interdural distance (TIDW), transverse inter-V-point distance, and anatomical facet joint width were measured.
Results
The mean TIDW decreased as the levels down in the 40s–60s but increased at the C4–5, C5–6, and C6–7 levels in the 70s. Statistically significant difference was shown at the C6–7 level between the 40s and the 70s. The mean anatomical inter-V-point distance markedly decreased at C5–6 and continued till the C7–Tl level at all age groups. Moreover, a statistically significant difference was shown at the C3–4 and C4–5 level between the 40s and the 70s. The mean negative values of SCW increased from the 40s to 70s at the C5–6 and C6–7 levels (C5–6: -0.60 ± 1.10 mm to -1.63 ± 1.56 mm; C6–7: -0.90 ± 0.74 mm to -2.18 ± 1.25 mm). There were statistically significant differences between the 2 aged groups at the C3–4, C4–5, C5–6, and C6–7 levels.
Conclusion
A prediction of the correlated position between the lateral dura edge and the V-point is essential for the PECF not to injure the neural structure. In the case of a performing the PECF at the C5–6 and C6–7 level in the old-aged patient, it should be considered the laterally moved dura edge, and more extended bony remove is needed for less neural structure damage.
INTRODUCTION
Endoscopic spinal surgery is becoming the standard for spinal surgery, and the posterior cervical approach is preferred for the cervical spine for various reasons [1-3]. Several randomized controlled trials and meta-analyses have demonstrated equivalent outcomes in patients undergoing spinal endoscopy for cervical radiculopathy treatment compared to the use of more conventional minimally invasive spinal surgery (MISS) techniques [4-6]. Of course, we can be sure that full-endoscopic (FE) posterior cervical foraminotomy (PCF) for cervical nerve roots decompression is a well-established, minimally invasive surgery for cervical radiculopathy [7-9].
However, surgeons should anticipate higher rates of complications and treatment failures with spinal endoscopic techniques compared to equivalent open or traditional MISS techniques during the early experience. Because, when we performed the FE surgery initially, a steeper learning curve to manipulate the nerve roots safely and anatomic structure identification are hard due to the limited visibility provided by a 5.9-mm diameter endoscope [7,10].
The cervical spine is the most critical part of the spinal cord and is the place that can cause the most complications with minimal damage. Therefore, the anatomical understanding of the nerve associated with the bony surgical structure will be an essential surgical guideline. Notably, the anatomical correlation of the dura lateral margin with the anatomical V-point becomes very important. In this study, we tried to obtain critical anatomical features applicable to the approach of the posterior endoscopic cervical foraminotomy (PECF) by age and levels, and the ways to minimalize the neural damage during operation.
MATERIALS AND METHODS
1. Study Patients
This study is a retrospective review of 80 patients who underwent 3-dimensional (3D) lumbar computed tomography (CT) and magnetic resonance imaging (MRI) due to the cervical spine-related symptoms from March 2018 through March 2020 at a single center (Gangnam Nanoori Hospital, Seoul, Korea). The patients were selected randomly regardless of their symptoms, but any cervical spinal operation was not performed. Eighty patients consisted of 20 people by age group from the 40s to 70s with the same sex distribution (male:female= 40:40) provided consent and were included in this study.
This study was approved by the Ethics Committee of Nanoori Hospital (NR-IRB 2020-020). Informed consent was obtained from the patients (exclusion: previous laminectomy or fusion operation, Ankylosing spondylitis, fused vertebral body, lamina Bifida, scoliosis with Cobb angle> 10°, vertebral body compression fracture).
2. Imaging Analysis
The images in this study were from a CT Machine (Supria, WCT-400-140, HITACHI, Tokyo, Japan), and a GE Signa 1.5-T HDxT MRI Machine (GE Healthcare, Milwaukee, WI, USA). All measurements were taken on MRI T2-weighted axial images arranged parallel to the intervertebral disc, and 3D reconstructed cervical CT anteroposterior images by drawing a line using an Infinitt PACS M6 Version (Infinitt Healthcare Co., Seoul, Korea). The MRI images were obtained using a fast spin-echo sequence with an echo train length of 28, a bandwidth of 25 Hz, a repetition time of 3,000 msec, echo time of 110 msec, a field of view of 160 × 160 mm, a number of excitations of 2, a slice thickness of 3 mm, and a slice gap of 0.5 mm.
We measured 3 parameters to characterize the anatomical relationship between the dura margin and the bony landmark. One value for the transverse interdura width was measured on the T2-weighted axial MRI image from the center of the C2–3, C3–4, C4–5, C5–6, C6–7, and C7–T1 intervertebral disc levels. One values for cervical bony landmarks (transverse inter-V-point distance) and one values for outer facet contour were measured on the 3D reconstructed CT image, as described below.
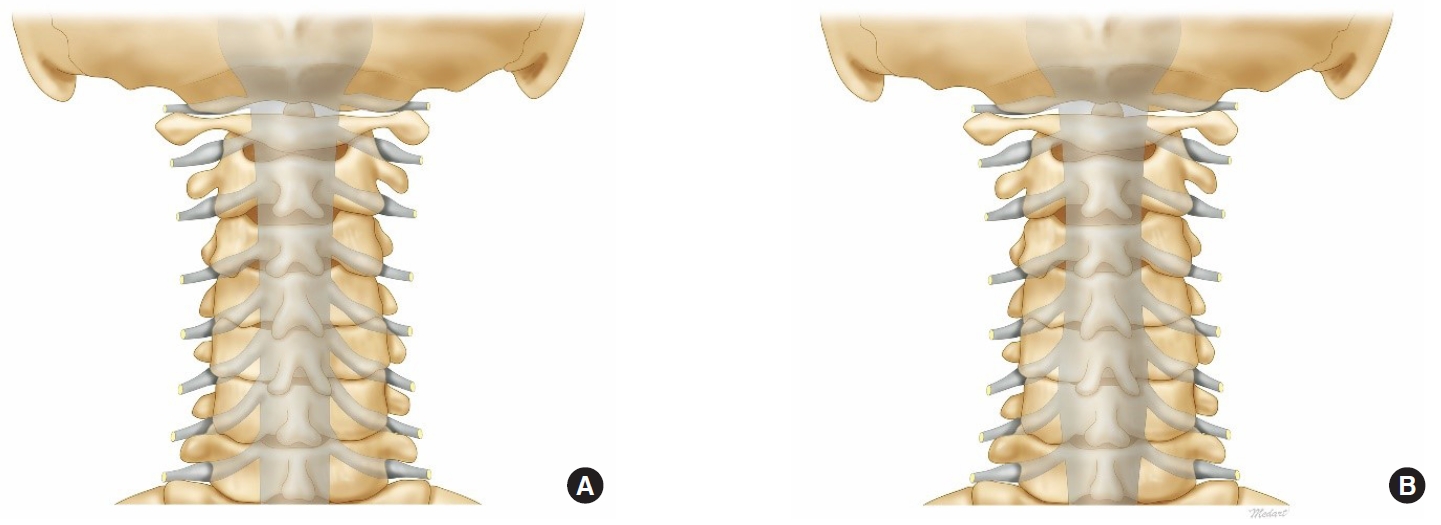
(1) Transverse interdura width (TIDW): The shortest linear distance was measured between the bilateral lateral dura edge (Fig. 1A).

Measurement of 3 parameters on the magnetic resonance imaging and the 3-dimensional computed tomography (3D CT) images. (A) Transverse interdura width was measured in the middisc level T2-weighted axial images. (B) Two values for bony landmarks and outer contour. a, anatomical inter-V point distance, b, anatomical facet joint width. Anatomical V-point is marked on a 3D CT image.
(2) Anatomical inter-V-point distance (AIVD): The shortest linear distance was measured between the bilateral V-points (Fig. 1B). The V-point included the inferior margin of the cephalic lamina, the medial junction of the inferior and super facet joints, and the superior margin of the caudal lamina (Fig. 1B).
(3) Anatomical facet joint width (AFW): The shortest linear distance was measured between the V-point and the most lateral border of the facet joint (Fig. 1B).
(4) Surgically critical width (SCW): We calculated the linear distance using the TIDW and the AIVD. The SCW calculation formula is (
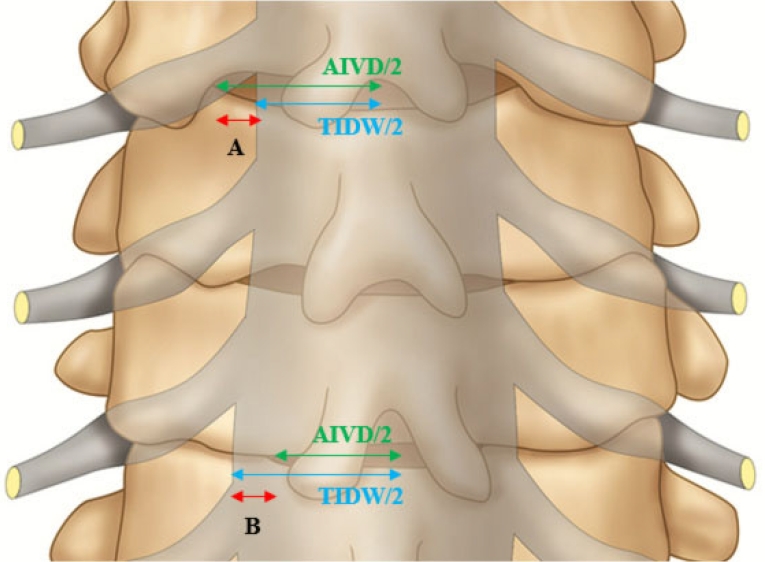
Application of the calculated SCW values to an illustrated image. A, positive SCW: V-point is located more lateral to the lateral dura edge. B, negative SCW: The lateral dura edge is located more lateral to the V-point. SCW, surgically critical width; AIVD, anatomical inter-V point distance; TIDW, transverse interdura width.
3. Statistical Analysis
Statistical analyses were performed using PASW Statistics ver. 18.0 (SPSS Inc., Chicago, IL, USA). We calculated the means and standard deviations (mean ± standard deviation) and assessed the statistical significance using the paired t-test. The mean values of each parameter were calculated at consecutive lumbar levels by 4 age groups. For confirming the change with age, it is divided into a middle-aged group (age, 40–49 years; n = 20) and old-aged group (age, 70–79 years; n = 20). Then, we compared the differences between mean values at consecutive levels in 2 age groups. A p < 0.05 was considered to indicate a statistically significant difference.
RESULTS
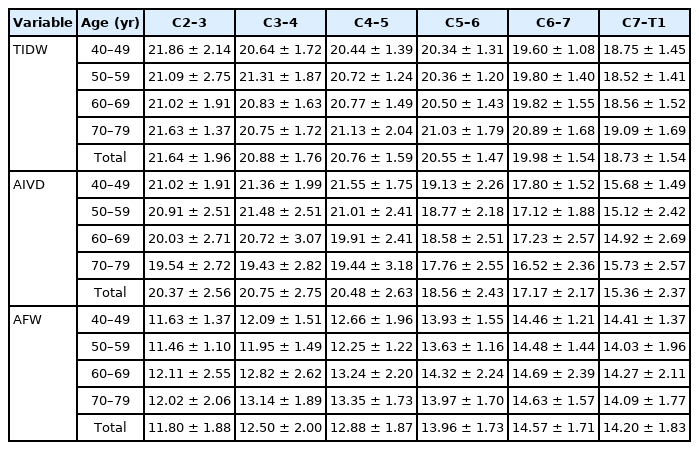
We measured the mean TIDW as interdura width, the mean AIVD as cervical bony landmarks, and the mean AFW as outer facet contour at all cervical levels by age group. We analyzed the values focused on the correlated position of the parameters and their changes according to age and levels. Notably, SCW is the most meaningful values representing the surgical anatomical relationship between the dura lateral edge and the V-point (Table 1, Fig. 2).
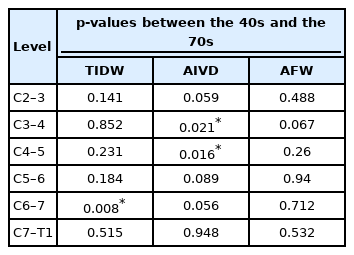
The mean AFW increased from the C2–3 to the C6–7 level and slightly decreased at the C7–T1 level in all age groups. The total mean AFW showed the same level-related change (Table 2). However, there was no specific aging-related change pattern, and there was no statistically significant difference between the 40s and the 70s at all levels (Table 3).
The mean TIDW decreased as the levels down in the 40s, 50s, and 60s. However, the mean values in the 70s showed different level-related changes, which increased values at the C4–5, C5–6, and C6–7 level than the C3–4 level (C3–4, 20.75 ± 1.72 mm; C4–5, 21.13 ± 2.04 mm; C5–6, 21.03 ± 1.79 mm; C6–7, 20.89 ± 1.68 mm) (Table 2). There was a constant aging-related increase at the C4–5, C5–6, and C6–7 levels in the 50s, 60s, and 70s. Statistically significant difference was shown at the C6–7 level between the 40s and the 70s (40s: 19.60 ± 1.08 mm, 70s: 20.89 ± 1.68 mm, p = 0.008) (Table 3).
The mean AIVD increased as level down to the C3–4, C4–5, then markedly decreased at C5–6 and continued till the C7–Tl evel at all age groups. The total mean AIVD showed the same level-related change (Table 2). Mean AIVD values of the 70s were lower than the values of the 40s, and statistically significant difference was shown at the C3–4 and C4–5 level (p < 0.05 at both levels) (Table 3).
The SCW (
In the 40s, the mean SCW showed positive values at the C3–4 (0.36 ± 1.25 mm), C4–5 (0.56 ± 1.14 mm), but negative values at the C2–3 (-0.42 ± 1.02 mm), C5–6 (-0.60 ± 1.10 mm), C6–7 (-0.90 ± 0.74 mm), and C7–T1 (-1.53 ± 0.78 mm) level. The greatest negative value was found at the C7–T1 level. But in the 70s, all mean SCW values showed negative values; C2–3 (-0.72 ± 1.35 mm), C3–4 (-0.66 ± 1.49 mm), C4–5 (-0.84 ± 1.48 mm), C5–6 (-1.63 ± 1.56 mm), C6–7 (-2.18 ± 1.25 mm), C7–T1 (-1.68 ± 1.21 mm). The greatest negative values were found at the C6–7 level. There were remarkable changes from the 40s to 70s at the C5–6 and C6–7 levels (C5–6: -0.60 ± 1.10 mm to -1.63 ± 1.56 mm, C6–7: -0.90 ± 0.74 mm to -2.18 ± 1.25 mm). There were statistically significant differences between the 40s and the 70s at the C3–4, C4–5, C5–6, and C6–7 levels (p < 0.05 at all levels) (Table 1).
Finally, we could represent the changes of all measured values in the illustrated images of the 40s and 70s. It would be beneficial if we focused on the correlated changed of the entire dura contour and position of the V-point (Fig. 3).
DISCUSSION
Minimal invasive surgery of PCF for symptomatic radiculopathy has gained popularity in the last decades, and FE and microendoscopic (MI) techniques widely applied to minimally invasive PCF [1,2,8,9,11,12]. Wu et al. (in 2019) analyzed the complications of FE-PCF and MI-PCF for cervical radiculopathy with a systemic review and meta-analysis [5,13]. This analysis of significant complications showed that the neural structure damage is the most common. In the FE group, transient root palsy made up 78.9% of all complications (15 of 19). In the MI group, dural tear (20 of 47, 42.6%), transient root palsy (10 of 47, 21.3%) constituted the most substantial proportion. In addition, Yang et al. [8] reported that 1 patient was subjected to neurologic exacerbation of the contralateral lower limb after FE-PCF because of intraoperative mobilization of the spinal cord. Despite the uneventful recovery of these 2 patients, the potentially serious consequence of cervical spinal cord injury was worthy of constant vigilance because the cervical spine is the most critical part of the spinal cord and is the place that can cause the most complications with minimal damage.
In the experienced hands of FE procedures, the risk of complications and treatment failure rates appears comparable to similar MISS procedures [5,13]. On the other hand, during the early experience, endoscopic spinal surgeons are necessary to repeatedly probe around the nerve root and retract with more angle and extent so that we should anticipate higher rates of nerve damage and treatment failures by a steeper learning curve associated with initial skill development and narrow surgical corridor.
Therefore, the cervical anatomical understanding of the nerve associated with the operational bony structure will be an essential endoscopic surgical guideline to decrease the neural structure injuries. These guidelines are necessary to not only the early experienced hands but also the experienced hands of FE procedures.
The V-point (including the inferior margin of the cephalic lamina, the medial junction of the inferior and superior facet joints, and the superior margin of the caudal lamina) has been used the beginning of bone drilling [10,14]. The bone removal area was assessed around the V-point by comparing it with the size of the drill. However, the V-point is not a constant site for the drilling due to patients’ anatomical differences. Anatomical location of the lateral edge of the dura and branch of the nerve root is not also constant, but no previous studies analyzed the changes between the V-point and the lateral edge of the dura. Therefore, the analysis and a prediction of the changing anatomical landmarks is essential for the PECF.
The transverse width of the dura (described as TIDW) decreased as the levels down in the 40s, 50s, and 60s, and it is an expected known anatomical knowledge. However, there were aging and level-related changes in the 70s, which increased the width at the C4–5, C5–6, and C6–7 levels. As the degenerative changes progress with aging, loss of disc height and degenerative kyphotic changes reduce the spinal canal’s anteroposterior diameter. Then, the compressed thecal sac is bulged to the bilateral side and induces the dura width increase (Fig. 4). The most cervical spine degenerative changes are associated with C4-5-6-7 levels, and our results are consistent with this known knowledge. Increased dura width means that the lateral edge of dura is moved to more laterally, and we may encounter the dura first instead of free epidural space after bone and flavum removal. We should keep in mind these results when operating the old-aged patient in the C4–5, C5–6, and C6–7 levels.
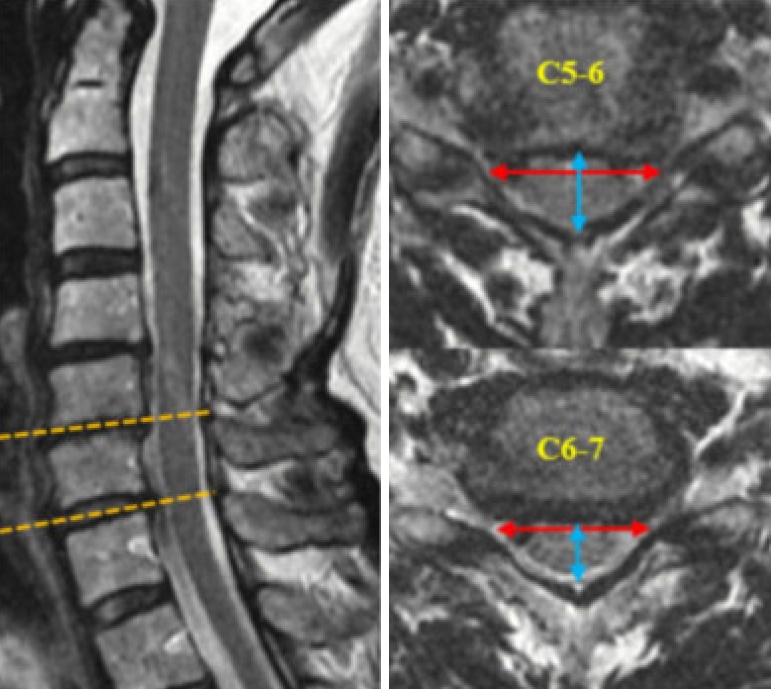
The changes of the dura contour adjust to the deformed intraspinal canal shape. Degenerative kyphosis with loss of disc height reduces the anteroposterior diameter of the spinal canal, and then, compressed thecal sac is bulged out to the bilateral side and induce the transverse interdura width higher.
We predicted that the interlaminar window width (described as AIVD) would increases as the levels down like the lumbar spine. However, our study showed that the interlaminar width was markedly decreased at C5–6 and further decreased till the C7–T1 level at all age groups. Furthermore, the values of the 70s were significantly decreased than in the 40s.
In the middle-aged group, the dura width and the interlaminar width decreased in the same direction so that we can predict the relative position between the lateral dura edge and the V-point with less remarkable errors. In the old-aged group (the 70s), significant changes of 2 parameters found, the dura width increased in the C4–5, C5–6, and C6–7 level, but interlaminar width more decreased according to the aging. These results mean that the lateral dura edge would be more laterally located than the V-point in the C4–5, C5–6, and C6–7 level, considerable attention is required not to injury the nerve structures (Fig. 3).
For more exact prediction, we set the calculated value as “SCW: (
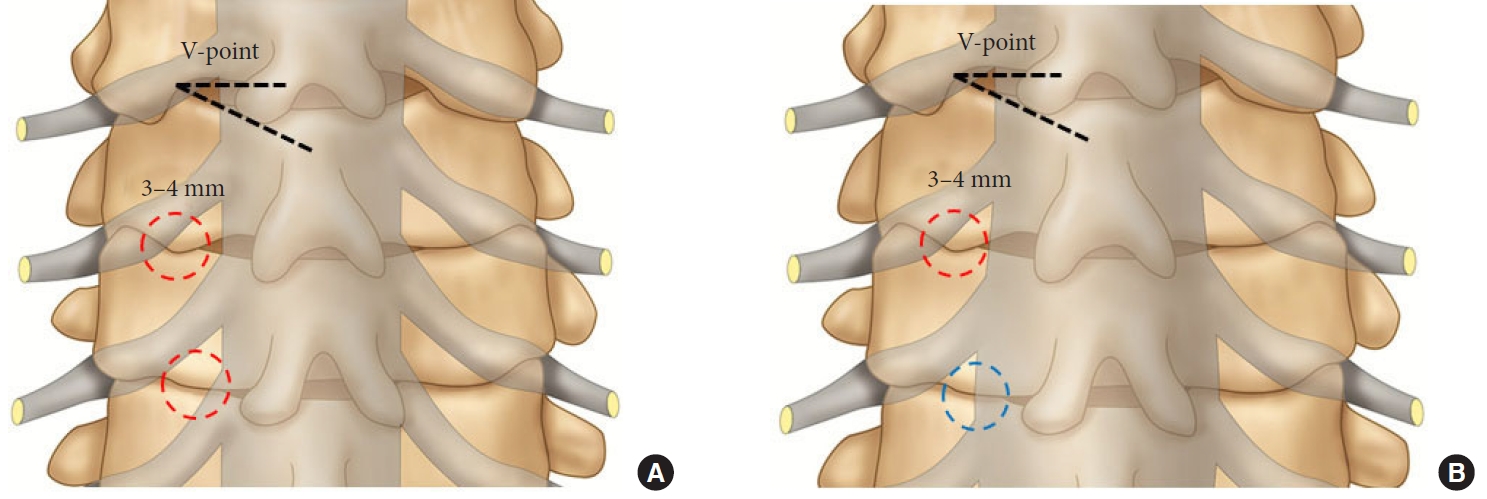
The extent of bony removal from the V-point. (A) Image of the 40s. (B) Image of the 70s. The encircled areas show the extent of bony removal. After bone removal, we usually first encountered the free axillary epidural space, the exiting root, and dura lateral margin (red dotted circle). In the case of laterally displaced dura margin, we may encounter the dura that fills most of the surgical corridor instead of free epidural space (blue dotted circle).
Despite the 40s, the SCW negative value is meaningfully high in the C6–7 and C7–T1 level (C6–7: -0.90 ± 0.74 mm, C7–T1: -1.53 ± 0.78 mm) so that we should extend the bone drilling to a lateral direction at least calculated negative SCW values. It may not induce the facet joint instability, because measured facet joint width (described as AFW) in the C6–7 and C7–T1 is about 14 mm (Table 2) so that we could remove the facet joint within the half of a facet joint width (7 mm).
In the 70s, the SCW remarkably increased to the negative in the C5–6 and C6–7 levels (Table 1). The lateral dura edge was located laterally more than we predicted, furthermore decreased foramen height squeezed the neural structures more. So, we should perform the bone drilling further superiorly to the caudal border of the rostral pedicle and laterally to the lateral border of the pedicle not to injure the neural structure. The endoscopic surgical view is very narrow and mobile, so it is difficult to estimate and find the pedicle margin for enough bone drilling. In this case, it is necessary to prepare the surgical plan to estimate the bony remove extent using the 3D spine CT and the MRI images, and our results may be beneficial for that (Tables 1, 2).
Another essential considering point is the surgical position of the cervical spine curvature. Insufficient neck flexion induces the V-point moves to more medially, and insufficient bony removal would be done than the predicted extent. In order to the neck is flexed and widened the interlaminar window, we may use the 3-point pin fixation devices with a table-mounted holder or craniocervical traction with a Gardner-Wells tongs skeletal fixation system [15]. Nevertheless, pins and rigid skull fixation are not generally required, the head is placed on a foam face support, with easily obtainable flexion, and taped down to maintain the position. The crucial point is that we should fully aware and adjust the neck flexion while taking a position. The CT and MRI were taken under the supine position, so the measurement values were from the supine positioned cervical spine. Because the operation is done under a flexed neck position, the mean SCW values could be changed, but the direction of the SCW would not be changed.
This study had certain limitations. First, we could not exclude the possibility of selection bias because this was a single-center retrospective study. Second, the sample of patients may not have been representative of the entire population of various races or nationalities. Third, measurement errors may have occurred because the MRI axial cut in the measurements used in our study had a 3.5-mm slice gap, and measurement variability could have existed across different individuals. Fourth, we measured the linear distance by drawing the line using an Infinitt PACS M6 Version (Infinitt Healthcare Co., Seoul, Korea) for MRI and CT images. The axial images of MRI and CT have the same magnification, but the axial image and 3D CT did not have the same magnification. So, we calculated the magnification constant (3.12) accurately and applied it to the measurement.
The patients who were enrolled in this study had cervical spinal-related symptoms and underwent conservative management without operation. Most of the patients had some degenerative lesions, but not severe. Middle-aged patients had less degenerative changes than the old-aged group, and some of them had the normal anatomy. Therefore, the meaning of “prediction” could be applied to the old age group compared to the middle age group, not the young and normal anatomical group.
In the near future, we need a case-control study with a normal anatomical control group according to the disease type (spinal stenosis, herniated nucleus pulposus) and disease severity. Besides, a multicenter study with a better design and larger sample size would yield more reliable insights into the topic.
CONCLUSION
A prediction of the correlated position between the lateral dura edge and the V-point is essential for the PECF not to injure the neural structure. In the case of a performing the PECF at the C5–6 and C6–7 level in the old-aged patient, it should be considered the laterally moved dura edge, and more extended bony remove is needed for less neural structure damage.
Notes
The authors have nothing to disclose.


