Quantitative Comparison of Vertebral Structural Changes After Percutaneous Vertebroplasty Between Unilateral Extrapedicular Approach and Bilateral Transpedicular Approach Using Voxel-Based Morphometry
Article information

Abstract
Objective
To compare unilateral extrapedicular vertebroplasty (UEV) and bilateral transpedicular vertebroplasty (BTV) by quantitatively calculating the structural changes of fractured vertebral body after percutaneous vertebroplasty (PVP) using 3-dimensional voxel-based morphometry (VBM).
Methods
We calculated bone cement volume (BCV); vertebral body volume (VBV); leaked intradiscal BCV; and spatial, symmetric, and even bone cement distribution (BCD) in and out of 222 vertebral bodies treated with 2 different PVPs using VBM and evaluated the incidence of subsequent vertebral compression fracture (SVCF). Statistical analyses were conducted to compare values between the 2 different PVPs.
Results
Relative BCV, which is a potential risk factor for SVCF, was higher in the BTV group based on the data using VBM (0.22±0.03 vs. 0.29±0.03; p<0.001, t-test); however, the SVCF incidence between the 2 surgeries was not significantly different (UEV, 24.7%; BTV, 31%; p=0.046, chi-square test). Spatial, even, and symmetric BCD along the 3 axes was not significantly different between UEV and BTV using VBM (x, y, z-axis, p=0.893, p=0.590, p=0.908 respectively, chi-square test).
Conclusion
Contrary to intuitive concerns, UEV can inject a sufficient and more optimal BCV than BTV. Additionally, it can inject bone cement spatially, symmetrically, and evenly well-distributed without an increased rate of intradiscal leakage and SVCF compared with BTV based on VBM. Therefore, UEV could be a superior alternative surgical method with similar clinical effectiveness and safety, considering the above results and the consensus that UEV is less invasive.
INTRODUCTION
Thoracolumbar osteoporotic vertebral compression fracture (OVCF) causes severe back pain and spinal deformities that affect patients’ quality of life [1,2]. However, in most cases, it can be safely and effectively treated using conservative or surgical therapy. Notably, percutaneous vertebroplasty (PVP) has been introduced and is currently a representative surgical treatment for thoracolumbar OVCF because of its benefit of relieving immediate pain, stabilizing fractured vertebral bodies, and minimal invasiveness [1,2]. Although PVP has shown satisfactory results, several important prospective randomized controlled trials have reported conflicting results without concluding that PVP is more efficient than conservative technique in OVCF treatment [3-8]. One of the most important reasons for the abovementioned facts is the high incidence of subsequent vertebral compression fracture (SVCF) , which is the most problematic complication after PVP [8,9]. Moreover, the risk factors of the SVCF after PVP are insufficiently proven [8-10]. In many cases, thoracolumbar OVCF can be safely and effectively treated; however, its treatment using PVP frequently involves multiple SVCF, which may cause persistent back pain requiring subsequent PVP, spinal deformity, functional limitations, and neurological symptoms [1,8,10]. Despite this background, PVP is being performed more frequently and widely [1,2]. Moreover, regardless of the intuitive concerns and some negative clinical experiences that unilateral PVP cannot spatially well distribute sufficient bone cement volume (BCV) compared with bilateral PVP, it is recently being increasingly performed because it can reduce operation time, and radiation exposure [1,2,11-13]. Several recent studies reported that unilateral PVP procedures could achieve equivalent pain relief and complication rates with reduced operative time, radiation exposure, and bone cement leakage compared with bilateral PVP [1,2,11-13]. Although clinical efficacy and complication occurrence rate after PVP has been strongly correlated with BCV and bone cement distribution (BCD) in and out of the fractured vertebral body, these previous studies concluded that unilateral PVP is a better procedure than bilateral PVP without the most important comparison of structural change induced by injected BCV and BCD between the two surgeries [14-18]. Additionally, no study has compared and analyzed the incidence of SVCF as the most problematic complication between unilateral and bilateral PVP. As mentioned above, this was an exaggerated conclusion based on insufficient results. Many spinal surgeons have encountered various clinical scenarios indicating that unilateral extrapedicular vertebroplasty (UEV) is a less invasive approach with noninferior clinical results compared to bilateral transpedicular vertebroplasty (BTV). However, whether UEV produces comparable clinical outcomes to BTV remains unanswered due to methodological limitations and is still pending verification. Therefore, this study aimed to prove that UEV could be a less invasive superior alternative surgical method with similar clinical effectiveness and safety. Accordingly, here, a comparative analysis of SVCF incidence between UEV and BTV was performed, and the surgery-related structural change induced by injected BCV and BCD was quantitatively analyzed by applying voxel-based morphometric (VBM) to overcome the limitations of previous comparative studies.
MATERIALS AND METHODS
1. Study Design
This retrospective study used the clinical and image data collected from consecutive cases between March 2014 and November 2019. The Institutional Review Board of the Catholic University of Korea College of Medicine, Daejeon St Mary’s Hospital approved this study (DC20RISI0036), and the requirement for informed consent was waived because we anonymized and shared the image data for the collaborative study of VBM.
2. Inclusion Criteria
(1) Patients diagnosed as single-level OVCF using bone mineral density (BMD) evaluation (T score < -2.5) and magnetic resonance imaging (MRI) (Magnetom Verio 3T; Siemens Healthineers, Erlangen, Germany).
(2) Patients who underwent UEV or BTV for single-level OVCF.
(3) Patients with at least 3 years of follow-up for the diagnosis of adjacent vertebral compression fracture (AVCF) or remote vertebral compression fracture (RVCF).
(4) Patients with computed tomography (CT) (SOMATOM Definition Flash, Siemens Healthineers) scan postoperatively performed during the follow-up period that enabled 3-dimensional (3D) VBM analysis.
(5) Patients who were treated with bisphosphonate alone following osteoporosis diagnosis.
3. Exclusion Criteria
(1) Patients with spondylodiscitis or pathologic fractures.
(2) Patients who underwent spinal surgery previously (PVP, microdiscectomy, decompressive laminectomy, and spinal fusion).
(3) Patients with diseases that induce or aggravate osteoporosis (vitamin D deficiency, previous paresis).
(4) Patients who were treated with antiosteoporotic medications, including receptor activator kappa B ligand (RANKL inhibitor), selective estrogen receptor modulators (SERMs), parathyroid hormone analogue (Teriparatide).
This study included patients with only single-level OVCF because clinical efficacy and complication occurrence rate after PVP could be closely associated with the number of OVCFs [10]. However, only patients with CT scan postoperatively performed during the follow-up period that enabled VBM were included because postoperative CT was not routinely performed in this retrospective study. Patients with various conditions that could affect BMD changes were excluded because clinical efficacy and complication rates after PVP strongly correlate with BMD [9,10]. This was ensured for accurate comparison of clinical efficacy and complication occurrence rate after PVP between the 2 surgeries, by reducing the BMD effect. Overall, 222 patients were enrolled and categorized according to the vertebroplasty method (UEV: 109 vs. BTV: 113) for comparative analysis between the 2 surgeries. Therefore, to differentiate clinical efficacy and complication occurrence rate between UEV and BTV, quantitative analyses of BCV, and BCD, calculation of exact BCV, fractured vertebral body volume (VBV), relative BCV (BCV/VBV), leaked BCV to upper intervertebral disc space, and axis-wise detailed distribution (spatial, symmetric, and even distribution of each axis) were performed using the VBM, which was initially applied to the field of spinal surgery in the authors’ previous study [10]. Radiographic parameters, including compression ratio (CR), kyphotic angle (KA), and sagittal index (SI), were measured on preoperative and postoperative radiographs collected at the earliest time after PVP. Additionally, CR, KA, SI, postoperative vertebral height restoration rate, and postoperative KA correction were measured and calculated using similar methods to the authors’ previously published paper by an experienced spine surgeon [10,19]. Clinical parameters, including visual analogue scale (VAS) score, follow-up duration, SVCF occurrence, and duration of PVP to SVCF, were obtained from medical records [10]. Comparative analyses of these radiographical and clinical parameters were performed between the 2 different surgeries. Furthermore, patient characteristics were used for baseline comparison between UEV and BTV.
4. Surgical Procedure
Before PVP, we administered opioids to the patients intravenously for sedation and monitored vital signs and arterial oxygen saturation during the whole PVP procedure [10]. We installed 2 C-arms (Siemens Healthineers) around the prone positioned patients on radiolucent operating table anteroposterior (AP) and laterally for simultaneous viewing [10]. Subsequently, with the surveillance of 2 C-arm fluoroscopies, 2 different PVP procedures were performed using a 13-gauge vertebroplasty needle (Stryker Corp., Kalamazoo, Miami, USA) [10].
In the case of BTV, which is a well-known method, the skin entry points were located at the 3 o’clock position in the lateral margin of the right pedicle on an AP fluoroscopic view, and vertebroplasty needle was introduced into the vertebral body (9 o’clock position in the lateral margin of the left pedicle) [20]. In the case of UEV, it is crucial to place the needle in the ideal position, vertebral body center to place optimal BCV well distributed. We performed a far lateral UEV, which is appropriate to achieve ideal needle placement (Fig. 1). Regarding the far lateral UEV, we made a skin incision approximately 10 mm lateral to point on the AP fluoroscopic view in the case of the thoracic spine (Fig. 1A) [21,22]. After the skin incision, a vertebroplasty needle was introduced at point b, which was adjusted directly to point t, and subsequently advanced to point c (Fig. 1A–D) [21,22].

Far lateral unilateral extrapedicular vertebroplasty. (A) Point a: the ipsilateral costotransverse joint on anteroposterior fluoroscopic view in the thoracic spine. In lumbar spine cases, skin incision was made approximately 10 mm lateral to the lateral 1/3 of the ipsilateral transverse process [21,22]. After the skin incision, the vertebroplasty needle is advanced point b: the outer border of the base of the ipsilateral pedicle maintaining an angle of 45° between the horizontal plane [21,22]. (B) After penetrating the cortex of the vertebral body, the needle is directed to point t where the lower end plate meets the anterior cortex of the vertebral body in lateral view [21,22]. (C, D) The needle is advanced to point c: the center of the fractured vertebral body, with the surveillance of 2 C-arm fluoroscopies [21,22].
5. 3D VBM Analysis
VBM was initially applied in the research of spinal surgery and has been described by the authors in the previous study [10]. The proposed VBM calculates BCV, BCD, VBV, intervertebral disc volume, and leaked intradiscal bone cement volume (IBCV) [10,23,24]. Quantitative data based on VBM were applied to resolve debates in clinical medicine, and the results were successful [10]. In this study, the process of VBM was systematized with some advanced techniques [10]. A volumetric measurement framework developed based on the Medical Imaging Interaction Toolkit (MITK; German Cancer Research Center, Heidelberg, Germany) was used to conduct all processing tasks, such as segmentation and 3D voxel-based analysis [10,23,24].
1) Segmentation and defining the unit voxel
Defining the unit voxels in the region of interest is the first step in quantitative analysis; the characteristics of each region of interest need to be considered for accurate voxel-based analysis.
We separated the regions of interest from CT or MRI data using the Segmentation plugin and Segmentation Utilities plugin of MITK. These plugins support 2-dimensional (2D) and 3D tools, allowing for segmentation of individual pixels in 2 dimensions using algorithms, such as thresholding, Otsu [25], Region Growing [26], and Watershed [27], and automated segmentation of individual voxels in 3 dimensions using an advanced interpolation technique. In the case of vertebral body segmentation, we focused on achieving precise contour along the PVP-treated vertebral body [10,23,24]. Therefore, the final segmentation results could be a 3D shape that accurately reflects the detailed morphological shape of the irregularly shaped fractured vertebral body based on the vertebral body unit voxels, but not on the manual measurements on CT images (Fig. 2A–D) [10,23,24]. Our advanced approach ensures accurate analysis results with limited interpolation, which is only applied when linearity of the surface can be provided from interpolated slices. This differs from the previous method of interpolating from the contour of a few slices, which could lead to distortions in analysis in certain cases and inaccurately reflect detailed 3D morphological shapes (Fig. 2E) [10,23,24]. The injected bone cement region has a highly distinguishable intensity distribution in CT or MRI, and the segmentation was conducted using an intensity-based thresholding technique [10,23,24]. Additionally, the bone cement region segmentation was further refined by manually removing any incorrectly segmented regions (Fig. 2F–H) [10]. However, when there was leaked intradiscal bone cement, intervertebral disc segmentation was performed similarly to vertebral body segmentation, and a clear boundary between the vertebral body and the intervertebral disc was obtained using postprocessing techniques (Fig. 2I, J).

Segmentation process and 3-dimensional mesh construction result of the vertebrae. (A) A sagittal slice of the selected vertebrae for analysis. (B) Automated vertebral body segmentation result on a sagittal slice. (C) Refined vertebral body segmentation result on a sagittal slice. (D) An axial slice after slice-by-slice correction for vertebral body segmentation. (E) Inaccurate interpolated contour with few slice segmentations. (F) Bone cement segmentation result using thresholding algorithm. (G) Refined bone cement segmentation result. (H) An axial slice after bone cement segmentation. (I) Result of the intervertebral disc segmentation with a clear boundary on a sagittal slice. (J) An axial slice after Intervertebral disc segmentation.
2) Volume analysis based on the unit voxel
The second step is computing the volumes of the region of interest by the unit voxel. The unit voxels, which are the fundamental unit in 3D images and correspond to pixels in 2D images, were categorized as vertebral body (SVB), adjacent disc (SAD), or bone cement (SBC) and the unit voxel volume was computed from the spatial resolutions of the image. Therefore, the volume measurements for the region of interest were determined by summing these unit voxels [10].
Two postdoctoral researchers with expertise in medical image engineering, having 7 and 3 years of experience, performed the process.
3) 3D model for BCD analysis
The basic materials for 3D voxel-based analysis were prepared through segmentation. The separation results can be interpreted consistently using the custom plugin modules of 3D analysis [10]. As a first step of the 3D BCD analysis, we created a mesh (surface) model of the segmented fractured vertebral body using a marching cube algorithm (Fig. 3A) [10]. However, the generated meshes that lie on the axial, coronal, and sagittal axes were not aligned with the vertebrae. Therefore, we defined three local axes of the vertebral body (inferior-to-superior, left-to-right, and posterior-to-anterior) to analyze the BCD. For this, the vertebral shape model was projected onto the sagittal plane, which closely corresponds to the actual orientation of the vertebral body in MRI or CT, and identifies the compact convex contour, which is known as a convex hull. From this convex hull, the local axes were determined using the cost function of prior knowledge about the typical vertebral body shape (Fig. 3B, C). Defining the local axes helped in the vectorization of the voxels, labeled as bone cement, along the vertebrae itself. We accurately calculated the direction and distance of many bone cement voxels from the fractured vertebral body center. Additionally, we plotted these vectorized voxels along the three axes to quantitatively evaluate the BCD in and out of the fractured vertebral body not only spatially but also evenly and symmetrically. We constructed histogram plot charts indicating the positions of the vectorized voxels labeled bone cement along the three axes to conduct the BCD analyses and calculated the skewness, kurtosis, median, mean, standard deviation, minimum, and maximum bone cement voxel values [10,24]. Furthermore, we computed the minimum and maximum vertebral body voxel values using vectorized voxels labeled vertebral bodies along each axis [24]. The even and symmetric aspects of BCD in the vertebral body after PVP were evaluated based on the skewness and kurtosis values of each of the three axes [28]. The cases where |skewness|< median |skewness| and kurtosis < 0 were considered as evenly and symmetrically distributed [28]. The cutoff values (median |skewness| of the evaluated population) of each axis for defining even and symmetric distribution were 0.1569395 in x-axis, 0.1556293 in y-axis, and 0.1989452 in z-axis in this study. Conversely, the cases where the range of bone cement voxels covered the center of fractured vertebral body and simultaneously, (maximum value – minimum value of bone cement voxels)/(maximum value – minimum value of vertebral body voxels) were ≥ 0.5 was considered as spatially well-distributed cases. Finally, these 4 abovementioned criteria were used to evaluate and compare the spatial, even, and symmetric distributions in this study [10,28].
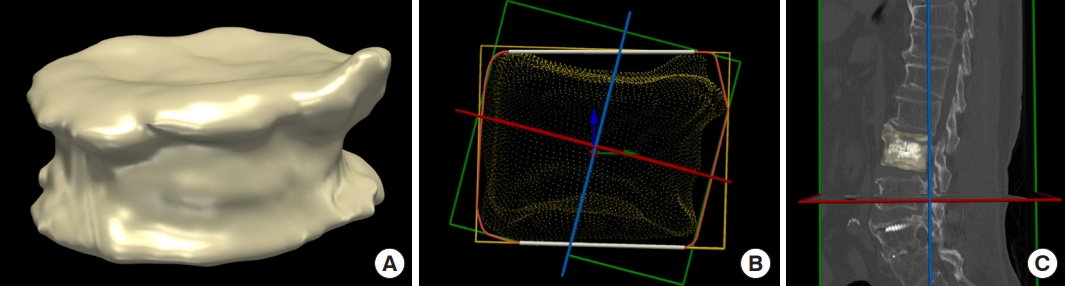
Reconstructed 3-dimensional vertebral body mesh model and its local frame. (A) Three-dimensional visualization for reconstructed vertebral body model. (B) Convex hull and local reference frame of the vertebral body (red arrow: left-to-right axis, green arrow: posterior-to-anterior axis, blue arrow: inferior-to-superior axis). (C) Reconstructed vertebral body model with its local axes superimposed on a sagittal slice.
6. Statistical Analysis
Continuous variables were expressed as mean±standard deviation or median (interquartile range) and analyzed using a t-test or Wilcoxon rank-sum test. Conversely, categorical variables were presented as frequencies and percentages and analyzed using the chi-square or Fisher exact test. Multivariable logistic regression analyses were conducted to identify the surgical method (independent variable) for non-SVCF vs. SVCF (dependent variable). Variables of age, sex, BMD, z-axis distribution, and upper intradiscal leakage were used together as covariates to adjust and analyze the full model. Odds ratios (ORs) were calculated using multivariable logistic regression. Furthermore, we consulted the Department of Biostatistics of our research center regarding the design of the statistical analyses for this study. All statistical analyses were performed using SAS 9.4 (SAS Institute, Cary, NC, USA). All tests were 2-tailed, and statistical significance was considered at p<0.05.
RESULTS
1. Characteristics of the Study Population
Overall, 222 of the 873 consecutive patients with OVCF treated with PVP from March 2014 to November 2019 were enrolled in this study. Among the 222 enrolled patients, 109 and 113 underwent UEV and BTV, respectively. No statistically significant difference was found in the patients’ baseline characteristics between UEV and BTV groups (Table 1).

Characteristics of the study population
2. Bone Cement Distribution
Spatial, even, and symmetric BCD along the 3 axes were not significantly different between the UEV and BTV groups based on the data using VBM (p=0.893: x-axis, p=0.590: y-axis, and p=0.908: z-axis, chi-square test; Table 2). Particularly, the distribution along the inferior to the superior axis, which is known as a potential risk factor for AVCF, was not significantly different between the BTV and UEV groups based on the accurate data calculated using VBM (p=0.908, chi-square test) (Table 2, Fig. 3B). Contrary to intuitive concerns and some clinical experience that bone cement cannot be evenly distributed to both sides in UEV compared with BTV, UEV procedure spatially, evenly, and symmetrically well-distributed bone cement without increased risk of SVCF.

Comparison of bone cement volume, distribution, and leakage between unilateral extrapedicular vertebroplasty and bilateral transpedicular vertebroplasty
3. Bone Cement Volume, Leakage
Significantly larger BCV was injected in the BTV group than in the UEV group (4.91 [3.81–5.25] mm3 vs. 6.85 [6.29–7.59] mm3, Mann-Whitney U-test; Table 2). BCV/VBV, which is known as a potential risk factor for ACVF, was significantly higher in the BTV group than in the UEV group (0.22±0.03 vs. 0.29±0.03, p<0.001, t-test). Therefore, the BCV/VBV of the UEV group was more optimal than that of the BTV group, with a significant difference (p<0.001, t-test). The incidence of venous leakage, upper intradiscal leakage, and lower intradiscal leakage of the bone cement were not significantly different between the UEV and BTV groups based on the data using VBM (p=0.213, p=0.056, and p=0.762, respectively, chi-square test). Leaked IBCV was higher in the BTV group than in the UEV group without a significant difference (759.91±650.14 vs. 1,013.24±798.70, p=0.176, t-test) (Table 2, Fig. 4E). Bone cement leakage to the upper intervertebral disc space, which is known as a risk factor for AVCF, occurred more frequently in the BTV group than in the UEV group without significant difference (UEV: 11%, BTV: 23%, p=0.056).

Visualization of bone cement volume and distribution in and out of fractured vertebral body based on voxel-based morphometry data in various cases. (1) Representative visualization of the reconstructed model with its center and 3 axes of the local reference frame (x [left-to-right] axis: red arrow, y [posterior-to-anterior] axis: green arrow, z [inferior-to-superior] axis: blue arrow). (2) Visualization of the reconstructed model with its center and x-z axes of the local reference frame. (3) Visualization of the reconstructed model with its center and y-z axes of the local reference frame. (4) Visualization of the reconstructed model with its center and x-y axes of the local reference frame (bone cement volume [red] in the fractured vertebral body, leaked intradiscal bone cement [green] into the adjacent intervertebral disc [white]). (5) Histogram showing the distribution of the bone cement voxels along the left-to-right axis. (6) Histogram showing the distribution of the bone cement voxels along the posterior-to-anterior axis. (7) Histogram showing the distribution of the bone cement voxels along the inferior-to-superior axis (blue portion of the histogram: number of bone cement voxels in the vertebral body, green portion of the histogram: number of leaked intradiscal bone cement voxels). (A) Bilateral transpedicular vertebroplasty (BTV) injected a sufficient volume of bone cement and distributed the bone cement evenly and symmetrically along the 2 axes, but bone cement distribution along the z-axis was even, but slightly asymmetrical: |skewness| of x-axis: 0.1042< median |skewness|: 0.1569395, kurtosis of x-axis: -1.19782< 0, |skewness| of y-axis: 0.090784< median |skewness|: 0.1556293, kurtosis of y-axis: -0.72028< 0, |skewness| of z-axis: 0.317716> median |skewness|: 0.1989452, kurtosis of z-axis: -0.66218< 0. (B) Unilateral extrapedicular vertebroplasty (UEV) injected a sufficient volume of bone cement and distributed the bone cement evenly and symmetrically along the three axes.: |skewness| of x-axis: 0.064327< median |skewness|: 0.1569395, kurtosis of x-axis: -0.95138< 0, |skewness| of y-axis: 0.11267< median |skewness|: 0.1556293, kurtosis of y-axis: -0.96114< 0, |skewness| of z-axis: 0.018557< median |skewness|: 0.1989452, kurtosis of z-axis: -0.77733< 0. (C) UEV injected insufficient volume of bone cement and distributed the bone cement unevenly, asymmetrically, especially along the z-axis because of early lower intradiscal leakage during the procedure.: |skewness| of z-axis: 0.76018> median |skewness|: 0.1989452, kurtosis of z-axis: 0.606852> 0. (D) BTV distributed bone cement asymmetrically along the y-axis: even, but anteriorly skewed asymmetric distribution.: |skewness| of y-axis: 0.273962> median |skewness|: 0.1556293, kurtosis of y-axis: -0.53269< 0. (E) BTV unevenly and asymmetrically distributed bone cement along the y- and z-axes: uneven, anteriorly, and superiorly skewed asymmetric distribution.: |skewness| of y-axis: 0.656754> median |skewness|: 0.1556293, kurtosis of y-axis: 0.626505> 0, |skewness| of z-axis: 0.678438> median |skewness|: 0.1989452, kurtosis of z-axis: 0.606852> 0. After injecting an insufficient volume of bone cement through the right-side needle, a relatively large volume of bone cement was injected intentionally. However, it was leaked to the upper intradiscal space. Upper adjacent vertebral compression fracture occurred 4 weeks after the BTV. (F) UEV distributed bone cement evenly but a little asymmetrically along the z-axis: even, but slightly superiorly skewed distribution: |skewness| of z-axis: 0.2042438> median |skewness|: 0.1989452, kurtosis of z-axis: -0.22417< 0. After placement of the vertebral needle tip just above the center of the vertebral body and near the fractured upper endplate, bone cement was injected and leaked to the upper intradiscal space through the fractured upper endplate, resulting in bone cement distributed mostly in the upper half of the fractured vertebral body.
4. Incidence of SVCF, AVCF, and RVCF
No significant difference was found in the incidence of SVCF, AVCF, and RVCF between the 2 groups (p < 0.303, p < 0.227, and p<0.924, chi-square test) (Table 3). Although BCV/VBV, which is known as a potential risk factor for AVCF, was significantly higher in the BTV group, no statistically significant difference was found in SVCF incidence between the 2 groups. Multivariate logistic regression analysis was performed to adjust for values of age, sex, BMD, distribution along the z-axis, and upper intradiscal leakage. Furthermore, the risk of SVCF in the BTV group was not higher than that of the UEV group based on multivariate logistic regression analysis (Table 3). In the case of PVP surgery for patients with very low BMD, high BCV/VBV could be act as a more significant risk for the occurrence of SVCF.

Comparison of incidence of SVCF between UEV and BTV and the multivariate logistic regression results
5. Postoperative Radiological and Clinical Outcomes
Postoperative vertebral height restoration rate was higher in the BTV group than in the UEV group; however, this trend was not statistically significant (0.08 [0.03–0.18] vs. 0.12 [0.04–0.20], Mann-Whitney U-test; Table 4). Additionally, postoperative KA correction was higher in the BTV group than in the UEV group without significant difference (1.98±1.71 vs. 2.02±1.62, p=0.844, t-test). Similar to the results of many previous studies, no significant difference was found in the postoperative pain relief between the 2 groups (5.44±1.11 vs. 5.59±1.12; p=0.308, t-test) (Table 4) [1,2,11-14,20].

Radiological and clinical outcomes
DISCUSSION
Thoracolumbar OVCF is common in older patients, and its complications sometimes affect the quality of life. PVP has become a representative surgical treatment for OVCF with several advantages, and unilateral PVP has recently been widely performed because of its advantages, such as short operation time and reduced radiation exposure [1,2,11-13]. Clinical efficacy and incidence of SVCF, which are the most problematic complication following PVP, are strongly correlated with the surgery-related structural changes induced by BCV and BCD in and out of the fractured vertebral body [10,11,14,17,18]. Nevertheless, these previous studies concluded that unilateral PVP is a better surgical method than bilateral PVP according to results comparing the postoperative pain relief, operation time, and radiation exposure alone rather than based on those comparing the surgery-related structural change and SVCF [1,2,11-13]. These previous studies drew exaggerated conclusions based on insufficient results because accurate quantitative measurements of the surgery-related structural changes of fractured vertebral bodies have been impossible in clinical studies thus far [1,2,10-14,17]. To the authors’ knowledge, no study has compared and analyzed SVCF incidence between UEV and BTV using reasonable and accurate methods, nor has any study compared the surgery-related structural change caused by injected BCV and BCD between UEV and BTV. Moreover, BCV and BCD after PVP, which are critically related to efficiency and complication rate, remain clinical controversies unresolved in many previous studies because of methodological limitations. Therefore, to solve these clinical pending questions, collaborative research using VBM, which is the only technique that can overcome these methodological limitations, was performed in this study as it can precisely measure and quantitatively calculate the structural changes induced by BCV injected in and out of the fractured vertebral body after PVP [10]. VBM has been introduced in brain research and applied for the first time in the clinical spinal research field in previous collaborative studies [10,23,24,28]. The BCV/VBV injected into the vertebral body has been closely associated with the clinical efficacy and SVCF incidence of PVP, mainly by previous in vitro cadaveric studies [10,29,30]. Although many biomechanical in vitro cadaveric studies have been conducted on this topic, optimal BCV with the ideal clinical efficacy of PVP has not been established [10,29,30]. A biomechanical in vitro cadaveric study by Martinčič et al. [31] indicated that 15% of the BCV/VBV can effectively strengthen the fractured vertebral body stiffness without increasing adjacent intradiscal pressure and 15%–20% of the BCV/VBV has a similar effect, and that relative BCV> 20% increases the adjacent intradiscal pressure resulting in increased pressure to the endplate of the adjacent vertebra, rather than stiffness restoration. Therefore, the study recommends 15% of the BCV/VBV as optimal BCV (4–6 mL of BCV depending on the vertebral level) [31]. Several major biomechanical studies indicated that a larger BCV/VBV in the augmented vertebral body is positively correlated with AVCF, which may be caused by increased intradiscal pressure and pressure on the adjacent vertebral bodies [29]. Notably, this biomechanical in vitro cadaveric study’s results were consistent with our previously published clinical research findings using VBM [10]. As VBM can calculate bone cement and vertebral body voxels, it enables the BCV/VBV measurement, which more efficiently reflects its biomechanical effect than BCV. In this study, the BCV/VBV was 0.22±0.03 and 0.29±0.03 in the UEV and BTV groups, respectively. Thermal injury to the pathologic nerve endings induced by injected bone cement alters and stabilizes the pain pathways in the surrounding tissue around the fractured vertebra [32,33]. This thermal effect causes immediate pain relief after PVP, and clinically, BCV for this process is not significantly correlated. Additionally, in this study, postoperative pain relief was not significantly different between the UEV and BTV groups (5.44±1.11 vs. 5.59±1.12, p=0.308, t-test). Specifically, even a small BCV/VBV of ≥ 10% injected into the vertebral body can induce immediate pain relief [31-33]. UEV was performed as previously reported [21,22]. UEV proposed by the authors has been devised as a method of needle placement at the center of the fractured vertebral body, and complications that occur during the needling process and bone cement injection can be reduced. It is highly useful at the thoracic level but requires proficiency. When needling is not optimal at the center of the irregularly shaped fractured vertebral body during UEV, large BCV may have to be injected unintentionally in order to distribute the bone cement well, leading to intradiscal leakage. Otherwise, the procedure may have to be completed with the not well-distributed bone cement in order to prevent intradiscal leakage or leakage to the spinal canal during the procedure despite injecting excessive BCV. Therefore, surgeons may have intuitive concerns and some negative clinical experiences with UEV. In contrast to intuitive concerns, the UEV procedure injected smaller but more optimal BCV/VBV efficiently without an increased risk of SVCF based on data calculated using VBM. Although unilateral PVP has been increasingly performed, there are still intuitive concerns and some clinical experiences that unilateral PVP cannot evenly and symmetrically well-distribute bone cement to both sides compared with bilateral PVP. These concerns about BCD of unilateral PVP were raised more frequently than regarding injecting sufficient BCV and have become the main reason for performing bilateral PVP. Therefore, a new surgical technique that uses a bending angle injector, in addition to percutaneous unilateral PVP, has recently been introduced [34,35]. However, studies on BCD have been limited. Most of the previous BCD studies only evaluated the bone cement location by counting the numbers of occupied sectors induced by injected bone cement after sectorizing the fractured vertebral body [8]. A study by Liu et al. [36] revealed that BCD evaluation using x-ray images is effective and can reliably predict SVCF after PVP. In contrast, a retrospective study by Lin et al. [37] showed that BCD using unilateral PVP was correlated with clinical efficacy after PVP by classifying the various BCDs into only 3 groups based on x-ray images. Several similar studies that categorize and compare BCD according to patterns have been published [11,12]. However, these studies were not based on accurate quantitative analysis of BCD; therefore, the evidence level was low. Despite many previous studies about BCD, the correlation between BCD and clinical efficacy, including the incidence of SVCF after PVP, remains a pending question because the quantitative calculation of BCD in and out of the fractured vertebral body was impossible in in vivo study using clinical data. Therefore, to solve the clinical issue of BCD, which is a more serious controversy than BCV, collaborative research using VBM was performed to quantitatively calculate the BCD in and out of the fractured vertebral body after PVP. Furthermore, the spatial, even, and symmetric distribution evaluation are required to evaluate the BCD, and clinical debate remains a pending question; therefore, the study was designed to meet these needs. Evaluation of spatial, even, and symmetric distribution was inevitable, particularly for comparative analysis between the UEV and BTV groups. VBM can automatically calculate the center of mass of the fractured vertebra and vectorize hundreds of thousands of bone cement unit voxels from this center [10]. The vectorization of unit voxels enabled an accurate understanding of the location of the unit voxels. These calculated and vectorized bone cement unit voxels were plotted along the three axes, and a histogram plot chart of each axis was constructed (bottom-to-top, left-to-right, and AP axes) [10]. Three-dimensional visualization using VBM and computed values based on these histograms along the 3 axes enabled the accurate quantitative comparison between the UEV and BTV groups for the first time. In the study, the UEV procedure spatially, evenly, and symmetrically well-distributed bone cement without increased risk of SVCF based on VBM in contrast to intuitive concerns and some clinical experiences, which indicate that bone cement cannot be evenly distributed to both sides in UEV compared with BTV (Table 2, Fig. 4C, D). A 2D pixel corresponds to a 3D voxel. As the various unit voxels of the regions of interest, such as bone cement, vertebral body, adjacent intervertebral disc, and leaked intradiscal bone cement voxels, can be calculated using VBM, a small amount of intradiscal bone cement leakage can be confirmed, which was impossible in a previous x-ray-based study [10].
Superior intradiscal bone cement leakage, which is a risk factor for AVCF, was frequent in the BTV group based on the data using VBM compared with that in the UEV group, without significant difference (UEV: 11%, BTV: 23%, p=0.056) (Table 2). Although the BCV/VBV, which is known as a potential risk factor for AVCF, was significantly higher in the BTV group, no statistically significant difference was found in SVCF incidence between the 2 groups (SVCF, AVCF, and RVCF, p<0.303, p<0.227, and p<0.924, chi-square test) (Table 3). Therefore, to evaluate the association between SVCF incidence and BCV and BCD using the UEV and BTV procedures, the effects of various risk factors for SVCF had to be reduced as much as possible [9,10,38]. BMD is the single factor known to be the strongest risk factor for SVCF [8-10]. Only patients treated using bisphosphonates alone before and after PVP were enrolled in this study to reduce the BMD effect on SVCF, whereas those treated with receptor activator kappa B ligand (RANK-L inhibitor), SERM, and parathyroid hormone analogues (Teriparatide) were excluded [10]. Additionally, multivariate logistic regression analysis was performed adjusting for age, sex, BMD, distribution along z-axis, and upper intradiscal leakage to specifically reduce the BMD effect, which is the strongest risk factor for SVCF and other multifactorial risk factors [8-10]. The OR of SVCF incidence was 1.110 times higher in the BTV group than in the UEV group, and the 95% confidence interval (CI) at this time was 0.570–2.123, without significant difference (p=0.776, Table 3). Models 2 and 3 showed an OR and 95% CI for AVCF and RVCF occurrence of 1.314 (0.564–3.066) and 0.951 (0.425–2.130), respectively, without significant difference (p=0.527 and p=0.904, respectively) (Table 3). Furthermore, no statistically significant difference was found in SVCF incidence between the 2 groups based on this multivariate logistic regression analysis (Table 3). The BCV/VBV of BTV was higher than that of UEV, with a significant difference (p<0.001, t-test). Consistent with these results, postoperative vertebral height restoration rate and KA correction in the BTP group were higher than that in the UEV group, without significant difference (p=0.151, Mann-Whitney U-test; p=0.844, chi-square test) (Table 4) [39,40]. Although this was a retrospective study, the number of patients in each group was similar, and there were no criteria for choosing between UEV and BTV. However, the authors, as experienced surgeons in UEV, performed UEV at a higher rate with the rationale of performing minimally invasive procedures regardless of the spinal level than average experienced spine surgeons. Although it did not account for a large number, UEV was preferred for older patients who do not cooperate well during the procedures. This study had some limitations. First, we conducted a comparative analysis of clinical outcomes to evaluate the efficiency of 2 different PVPs.
Postoperative pain relief (preoperative VAS-postoperative VAS) and SVCF incidence were assessed to compare the clinical outcomes. Additionally, BCV/VBV and BCD, which are procedure-related risk factors for SVCF, were calculated and compared using VBM. As this was a retrospective study, employing a well-known and useful outcome measure, such as the Oswestry Disability Index, was not possible; thus, using the postoperative pain relief data was the best possible option. Second, because postoperative CT scans are not routinely performed, inconsistency in the timing of their performance used in this study existed, which could have been a source of bias. However, these timings were not significantly different between UEV and BTV (Table 1). Finally, postoperative CT scans included not only spinal CTs but also 15 externally performed spinal, 28 abdomen, and 29 chest CT scans, and these resolution differences could have been a source of bias. Therefore, a well-designed randomized controlled trial using VBM based on postoperative CT scans performed using the same device and protocol is required for high evidence level.
CONCLUSION
UEV can inject slightly smaller but more optimal BCV than BTV, resulting in similar clinical efficacy and complication rate. Contrary to intuitive concerns, UEV can inject bone cement into the fractured vertebral body spatially, symmetrically, and evenly well-distributed without an increased rate of intradiscal leakage and SVCF compared with BTV. Therefore, considering the above results proven using the VBM and the consensus that it is less invasive, UEV could be a minimally invasive and superior alternative surgical method with similar clinical efficiency and safety.
Notes
Conflict of Interest
The authors have nothing to disclose.
Funding/Support
This research was supported by a grant from The Catholic University of Korea research foundation (grant number: 5-2020-B0001-00241).
Author Contribution
Conceptualization: TK, JP, HJL; Formal analysis: TK, JP, JC, JSY, HJL; Funding acquisition: HJL; Methodology: TK, JP, HJL; Project administration: TK, JP, HJL; Writing - original draft: TK, JC, HJL; Writing - review & editing: TK, JC, JSY, HJL.