Warning: mkdir(): Permission denied in /home/virtual/lib/view_data.php on line 81 Warning: fopen(/home/virtual/e-kjs/journal/upload/ip_log/ip_log_2024-03.txt): failed to open stream: No such file or directory in /home/virtual/lib/view_data.php on line 83 Warning: fwrite() expects parameter 1 to be resource, boolean given in /home/virtual/lib/view_data.php on line 84 Personal Health of Spine Surgeons Can Impact Perceptions, Decision-Making and Healthcare Delivery During the COVID-19 Pandemic - A Worldwide Study
Neurospine Search

CLOSE


Sayari, Harada, Louie, McCarthy, Nolte, Mallow, Siyaji, Germscheid, Cheung, Neva, El-Sharkawi, Valacco, Sciubba, Chutkan, An, and Samartzis: Personal Health of Spine Surgeons Can Impact Perceptions, Decision-Making and Healthcare Delivery During the COVID-19 Pandemic - A Worldwide Study

Abstract

Objective

To determine if personal health of spine surgeons worldwide influences perceptions, healthcare delivery, and decision-making during the coronavirus disease 2019 (COVID-19) pandemic.

Methods

A cross-sectional study was performed by distributing a multidimensional survey to spine surgeons worldwide. Questions addressed demographics, impacts and perceptions of COVID-19, and the presence of surgeon comorbidities, which included cancer, cardiac disease, diabetes, obesity, hypertension, respiratory illness, renal disease, and current tobacco use. Multivariate analysis was performed to identify specific comorbidities that influenced various impact measures.

Results

Across 7 global regions, 36.8% out of 902 respondents reported a comorbidity, of which hypertension (21.9%) and obesity (15.6%) were the most common. Multivariate analysis noted tobacco users were more likely to continue performing elective surgery during the pandemic (odds ratio [OR], 2.62; 95% confidence interval [CI], 1.46–4.72; p = 0.001) and were less likely to utilize telecommunication (OR, 0.51; 95% CI, 0.31–0.86; p = 0.011), whereas those with hypertension were less likely to warn their patients should the surgeon become infected with COVID-19 (OR, 0.57; 95% CI, 0.37–0.91; p = 0.017). Clinicians with multiple comorbidities were more likely to cite personal health as a current stressor (OR, 1.32; 95% CI, 1.07–1.63; p = 0.009) and perceived their hospital’s management unfavorably (OR, 0.74; 95% CI, 0.60–0.91; p = 0.005).

Conclusion

This is the first study to have mapped global variations of personal health of spine surgeons, key in the development for future wellness and patient management initiatives. This study underscored that spine surgeons worldwide are not immune to comorbidities, and their personal health influences various perceptions, healthcare delivery, and decision-making during the COVID-19 pandemic.

INTRODUCTION

The novel coronavirus disease 2019 (COVID-19) has affected both patients and healthcare providers around the world. The current healthcare landscape has changed, and healthcare delivery has molded to provide care to patients who otherwise would not receive it during these times [1,2]. However, despite our greatest efforts, the effects of COVID-19 have persisted, and the spine surgery community is not exempt. A recent study by Louie et al. [3] revealed the worldwide impact of COVID-19 on clinical practice, income, personal life, research, resident and fellow training, and anxiety levels among spine surgeons.
While many physicians have halted their surgical practices in lieu of restrictions on elective surgeries and face-to-face encounters, thousands of physicians, including spine surgeons, have found themselves at the front-line managing patients in the intensive care unit (ICU) and medical wards [4,5]. Worried that they themselves may become infected with COVID-19, physicians and other healthcare providers have become filled with fear. COVID-19 specifically affects the respiratory system, and can induce a pneumonia and chronic fibrosis with long-term sequelae, and may even lead to death [6]. Contrary to popular belief, physicians are fraught with cardiopulmonary and other comorbidities that increase the risk of complications from COVID-19 [7].
Several studies have noted physician burnout and mental health consequences [8-10]. However, there is limited evidence highlighting the physical health of spine surgeons. As physicians are finding themselves treating patients with COVID-19, the importance of physician health becomes even more relevant. Furthermore, as spine practices slowly return to normalcy, there is little understanding of how the health of spine surgeons will be affected, and how such health status influences spine surgery healthcare delivery in the age of COVID-19. Therefore, the authors aimed to examine the health disparities of spine surgeons around the world, and how their health influences their perspectives, healthcare delivery, and decision-making during the COVID-19 pandemic.

MATERIALS AND METHODS

1. Survey Design and Content

A survey, known as the AO Spine COVID-19 and Spine Surgeon Global Impact Survey, was developed to obtain representation from various global regions. Both multiple-choice and free-text questions were created based on input from multiple authors utilizing a Delphi method as previously reported [3]. Questions were structured to capture relevant components including: demographics, perceptions related to COVID-19, and the associated financial impacts, as well as future predictions. Comorbidities surveyed included cancer, cardiac disease, diabetes, obesity, hypertension, respiratory illness, renal disease, and current tobacco use.

2. Survey Distribution

Utilizing a secure email distribution method, the 73-item survey was administered to all AO Spine members who agreed to receive surveys, approximately 3,805 individuals. The survey recipients were provided 9 days to complete the survey (March 27, 2020 to April 4, 2020). Participants were notified of their willingness to contribute and that the information gained would be confidentially analyzed and published. Respondents were able to omit responses, and several questions allowed for multiple responses, altering the total number of responses to be less than or more than the total respondents.

3. Statistical Analyses

All statistical analyses were performed with Stata ver. 13.1 (StataCorp LC, College Station, TX, USA) with graphical representation of comorbidity distribution using RStudio v1.2.1335 (RStudio Inc, Boston, MA, USA). Survey findings were collected for each respondent and summarized using count data and percentage calculations. Medical comorbidities were then tabulated for each respondent, allowing stratification of the cohort into groups based upon the number of concomitant diagnoses (1, 2, 3, or more comorbidities, and no comorbidities). All comorbidity findings were then assessed using a combination of chi-square and Fisher exact tests to determine relevance with other collected survey responses.
Multivariate models were then derived to further assess the significance of comorbidities, controlling for age, sex, specialty, and practice type. All model covariates were selected and agreed upon by the senior coauthors due to the potential for confounding with assessed survey responses and comorbidity status. Multivariate logistic regression analysis was performed for binary outcome survey queries while multivariate ordinal logistic regression was performed for questions including ordinal scales. Odds ratios (ORs), 95% confidence intervals (CIs), and p-values were then calculated for each covariate and used to further assess comorbidity significance. ORs greater than 1 suggest that the assessed variable increases the likelihood of a particular response, whereas those less than 1 suggest a lower response. ORs equal to 1 indicate that the variable has no effect on either increasing or decreasing the likelihood of a given answer. Statistical significance was set at p < 0.05 and p-values were assessed for precision.

RESULTS

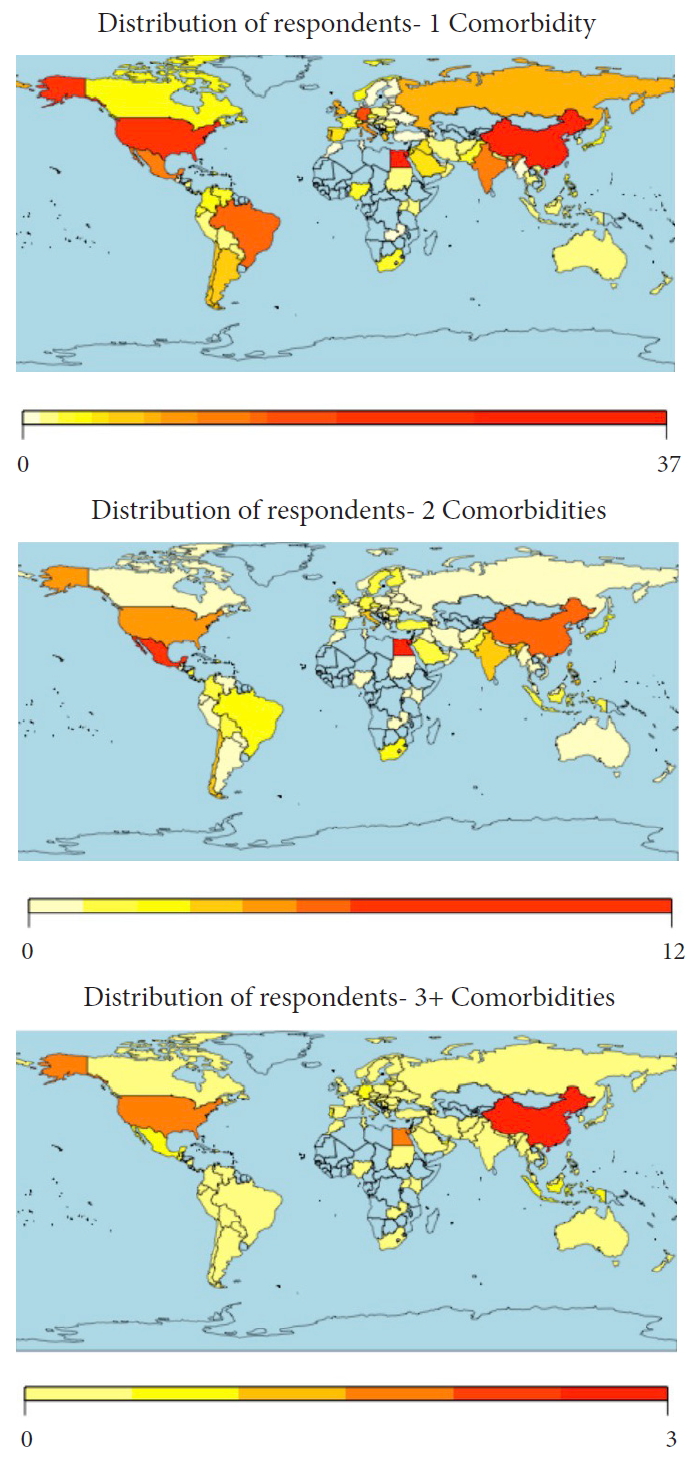
Of all spine surgeons surveyed, 902 participated, providing distinct data across 91 countries and 7 global regions affected by COVID-19. Detailed demographic results of the surveyed cohort have been previously published and reported by Louie et al. [3] Specifically, Table 1 presents the significant differences in age, specialty, and hospital practice type between regions. Roughly 36.8% of surgeons have at least 1 medical comorbidity, with hypertension (21.9%) and obesity (15.6%) being the most commonly reported. Further, some surgeons suffer from additional medical burden, with 10.2% and 2.6% reporting 2 and 3 or more comorbidities, respectively. Overall, despite these findings, most survey respondents are currently healthy (62.8%). There was also a significant difference in the prevalence of obesity, hypertension, tobacco use, diabetes, and the number of comorbidities between regions (p < 0.05) (Fig. 1).
When compared to healthy individuals, surgeons with specific comorbidities demonstrated significant variations in reported perceptions and stressors during the COVID-19 pandemic (Table 2). Surgeons suffering from obesity, hypertension, cardiac disease, and 1 or 2 comorbidities had significant concern about their personal health, whereas those diagnosed with cancer and respiratory illnesses were more concerned with return to nonessential activities and economic issues, respectively. Respondents with no comorbidities, hypertension, or 1 comorbidity were also more concerned with the timeline to resume clinical practice. A diagnosis of renal disease did not influence COVID-19 perceptions. Those with 3 or more comorbidities had the greatest influence on being personally diagnosed with COVID-19. Lastly, a diagnosis of cancer was associated with being quarantined (p = 0.007), though comorbidities otherwise had no association with institutional or governmental perceptions (Table 2).
There was also significant variation in those performing elective cases during the COVID-19 pandemic when comparing practitioners with and without comorbidities (any comorbidity: p = 0.006; 1 comorbidity: p = 0.003) (Table 3). There was also significant variation in respondents with diabetes and how they would warn their patients if they tested positive for COVID-19 (p = 0.026). Further, when compared to healthy clinicians, those with comorbidities (p = 0.031) or hypertension reported significant differences on impacted research productivity. Finally, regarding the implementation of specific surgical precaution, those with one or more comorbidities (any comorbidity: p = 0.014; 1 comorbidity: p = 0.033), hypertension (p = 0.020), tobacco use (p = 0.030), or cardiac disease (p = 0.049) had significant variation in whether they would be absent during patient intubation/extubation, while those with 1 comorbidity varied in their opinions to proceed with standard precautions (p = 0.036). There was no significant association between medical comorbidities and additional personal protective equipment (PPE) use during surgery.
When prompted, obesity was not associated with variations in personal impact and future perceptions (p> 0.05), but a perceived impact at 1 year varied significantly based on diagnosis (Table 4). Spine surgeons with hypertension (p = 0.004), tobacco use (p = 0.003), any comorbidity (p = 0.002), 1 comorbidity (p = 0.006), or 2 comorbidities (p = 0.020) had a significant association with increasing nonoperative care prior to surgery at 1 year. Telecommunication was also significantly associated with tobacco use (p = 0.025), diabetes (p = 0.009), and 2 comorbidities (p = 0.047).
Multivariate regression analysis controlling for baseline demographics, such as age, and practice-specific factors revealed that tobacco users were more likely to get prophylactically tested for COVID-19 (OR, 9.90; 95% CI, 1.10–89.14; p = 0.041). Those with hypertension were more likely to cite personal health as a current stressor (OR, 1.50; 95% CI, 1.00–2.22; p = 0.046), whereas spine surgeons with tobacco use were less likely to cite family health as a stressor (OR, 0.52; 95% CI, 0.28–0.97; p =0.039. Similarly, respondents with current tobacco use were more likely to still be performing elective spine surgery during the pandemic (OR, 2.62; 95% CI, 1.46–4.72; p = 0.001), more likely to pursue nonoperative care at 1 year (OR, 1.81; 95% CI, 1.0–3.28; p = 0.39), and less likely to be absent during intubation/extubation (OR, 0.51; 95% CI, 0.28–0.97; p = 0.038). In addition, those with hypertension were less likely to perceive their government’s pandemic management favorably (OR, 0.67; 95% CI, 0.45–0.99; p = 0.047) and were less likely to warn their patients should they become infected with COVID-19 (OR, 0.57; 95% CI, 0.37–0.91; p = 0.017). In comparison, under similar circumstances, those with respiratory illnesses were far more likely to warn their patients of a COVID-19 infection (OR, 5.23; 95% CI, 1.20–22.83; p = 0.028). Clinicians reporting a current tobacco use history were less likely to report utilization of telecommunication for recent clinical visits (OR, 0.51; 95% CI, 0.31–0.86; p = 0.011) (Table 5).
When grouped by number of comorbidities in the multivariate regression model, spine surgeons with more comorbidities were more likely to cite personal health as a current stressor (OR, 1.32; 95% CI, 1.07–1.63; p = 0.09) and more likely to be performing elective surgery (OR, 1.32; 95% CI, 1.02–1.71; p = 0.030), though also perceived their hospital’s management unfavorably (OR, 0.74; 95% CI, 0.60–0.91; p = 0.005), were less likely to currently use telecommunication clinical visits (OR, 0.82; 95% CI, 0.67–1.00; p = 0.05), and would less likely warn their patients of a personnel COVID-19 infection (OR, 0.74; 95% CI, 0.58–0.93; p = 0.010) (Table 6).

DISCUSSION

COVID-19 and its implications have raised concerns of patient health and safety. However, spine surgeons find themselves not only on the front-line during the height of such a pandemic but also facing the aftermath. Spine surgeons carry an increased work burden and are faced with stressors that compound health-related complications of comorbidities they may have. However, very little research has been published regarding spine surgeon well-being. Therefore, the authors utilized unique data from a COVID-19 global outreach survey to better understand health disparities in spine surgeons, which demonstrated that nearly 37% of participants had a major comorbidity, and those with more comorbidities were more likely to be concerned about their personal health, though they would also still be performing elective surgery. This is the first study to highlight the health of spine surgeons and how it relates to the perception of COVID-19 and how such a pandemic affects spine practices across the globe.
In a national health survey between 1986 and 1994, physicians were among the occupations with the lowest morbidity rate [11]. Similarly, fewer resources are allocated towards promoting preventative health measures for physicians when compared to other occupations. The current study identified a cohort of spine surgeons, most of whom were male and 44 years-of-age or younger, and yet nearly 37% reported a major comorbidity. While the United States has a nearly 10% incidence of diabetes, rates of obesity vary geographically [12,13], findings which were also highlighted in our present study as comorbidities varied across regions.
Hypertension and obesity were identified as the most commonly reported comorbidities, which is similar to recent studies analyzing COVID-19 [3]. Guan et al. [7] evaluated 1,590 patients diagnosed with COVID-19, noting an increased risk of ICU admission, invasive ventilation, or death in patients with chronic obstructive pulmonary disease (COPD) (hazard ratio [HR], 2.681), hypertension (HR, 1.58), diabetes (HR, 1.59), or malignancy (HR, 3.50). Similarly, a meta-analysis of 6 studies evaluating patients with COVID-19 identified hypertension (OR, 2.29), respiratory disease (OR, 5.97), cardiac disease (OR, 2.93), diabetes (OR, 2.47) as significant risk factors associated with COVID-19 [14]. Tobacco use which has historically been linked to respiratory disease such as COPD also increases the risk of complications associated with COVID-19 [15]. In a meta-analysis of 15 studies, Alqahtani et al. [16] evaluated the mortality rates in COPD and tobacco use associated with COVID-19. Their analysis revealed that tobacco users were nearly 1.5 times more likely to have severe complications from COVID-19 when compared to nonsmokers, and tobacco users had a significantly higher mortality rate approaching 40%. Furthermore, tobacco users were more likely to perform surgery during the pandemic, exposing themselves to a deadly virus, and yet were also more likely to cite personal health as a stressor, highlighting the importance of smoking cessation. Given these findings, However, those with a respiratory illness were far more likely to inform their patients if they were diagnosed with COVID-19, suggesting a sense of sympathy.
In the present study, irrespective of the COVID-19 outbreak, spine surgeons with more comorbidities were more likely to cite personal health as a current stressor. A study by Gross et al. [17] demonstrated that of 915 physicians, only 65% had a regular source of medical care, and not having such care was associated with having a diagnosis of malignancy and not having the influenza vaccine at 6-year follow-up. Taub et al. [18] performed a study regarding guidelines for physician health and wellness. Though seemingly rhetorical, the value of healthy living habits and having a personal physician is undervalued, as the current study highlighted how spine surgeons also have modifiable comorbidities such as tobacco use and obesity. Furthermore, orthopedic surgical training can induce hypertension, though transient in nature [19]. Similarly, neurosurgery has been demonstrated to increase intraoperative blood pressure to levels higher than vigorous exercise [20]. Regardless, respondents with 1 comorbidity varied in their opinions regarding standard precautions and a lack of association between number of comorbidities and use of additional PPE during surgery infers riskier behavior by surgeons who would otherwise benefit from heightened awareness of their health.
Future perceptions and financial impacts from COVID-19 were also linked to spine surgeon health. While there was an association between comorbidity diagnosis and being present during intubation/extubation, multivariate analysis suggested that tobacco users were less likely to be absent during patient intubation/extubation. As restrictions are lifted allowing elective spine surgery to be performed, spine surgeons should continue to remain wary of their health. At baseline, surgeons practice meticulous sterile technique, but these techniques may expand into the clinical setting. Furthermore, use of masks and gloves for routine visits may become commonplace. This may even become expected, as spine surgeons with increasing comorbidities are at increased risk for complications from communicable diseases such as COVID-19. Telecommunication as a means of delivering healthcare is becoming more commonplace [21], though was less likely to be utilized in the present study by spine surgeons with current tobacco use.
Similarly, univariate analysis of comorbidities suggested that unhealthier spine surgeons with comorbidities such as hypertension and tobacco use perceived that they would increase nonoperative measures over the next year. Fortunately, duration of symptoms is an inconsistent marker of postoperative outcomes [22]. On the contrary, spine surgeons with more comorbidities were more likely to be performing elective surgery during the pandemic, though they also perceived their hospital administration negatively.
Like the current study, substance abuse (tobacco in the current study) contributes significantly to overall health status, especially as physicians have been noted to neglect their own health [23]. Interestingly, the unhealthier population using tobacco were more concerned with their personal health, though they were also more likely to still be performing elective surgery during the pandemic. This highlights the lack of introspection of surgeons who may be facing economic pressures and may forget about their health. Furthermore, work-hour restrictions and avoidance of sleep deprivation in medical professionals, from the standpoint of spine surgeon health as well as patient safety, has increased awareness of overall physician health [24,25]. Aside from the noted comorbidities, stress management, family support, and recreation have been cited as tools to battle fatigue or burnout [26,27]. Not only does such burn out affect individual surgeon health but may affect productivity, outcomes, and patient care.
However, the present study is not without limitations. For one, if a respondent did not note any comorbidities, this could also imply that they did not feel comfortable to disclose such information, raising issues of transparency and willingness to share personal information via such a survey. However, the distribution of comorbidities, noting hypertension and obesity as the most common, would imply that the trend of capturing such information may be representative given the fact that such conditions are well known to be more common. Also, the present study did not compare perceptions between outbreak and non-outbreak nations facing COVID-19 despite the vast prevalence of the virus. Furthermore, there were several instances where having “1 comorbidity” would significantly influence perceptions and impacts from COVID-19, though each individual diagnosis was insignificant, highlighting the likely low statistical power of individual diagnoses. It is expected that statistical significance would emerge with a higher number of respondents with each diagnosis in such scenarios.

CONCLUSION

The present study is the first to map out comorbidities of spine surgeons across the globe, highlighting comorbidities that had a significant impact on healthcare delivery and clinical decision-making related to the COVID-19 pandemic. Without question, COVID-19 has impacted patients and healthcare providers worldwide. This study has emphasized the importance of spine surgeon health. Spine surgeons are not immune to common comorbidities, and as the surgical landscape slowly returns to normalcy, it becomes even more relevant for this community to remain introspective about their health to prevent any individual health-related complications and maximize optimal patient care and outcomes.

CONFLICT OF INTEREST

The authors have nothing to disclose.

ACKNOWLEDGEMENTS

The authors would like to extend their sincere gratitude to Kaija Kurki-Suonio and Fernando Kijel from AO Spine (Davos, Switzerland)for their assistance with circulating the survey to AO Spine members.

Fig. 1.
Geographical distribution of spine surgeons reporting medical comorbidities. Coloring of maps based on number of respondents with specified comorbidities.
ns-2040336-168f1.jpg
Table 1.
Medical comorbidity demographics
Variable Overall
Africa
Asia
Australia
Europe
Middle East
North America
South America/Latin America
p-value
No. % No. % No. % No. % No. % No. % No. % No. %
Age (yr)
25–34 127 14.4 5 11.4 28 13.2 0 0.0 29 12.0 16 20.8 28 18.5 21 14.5 0.017*
35–44 338 38.4 21 47.7 66 31.0 1 12.5 97 40.1 25 32.5 63 41.7 65 44.8
45–54 241 27.4 11 25.0 73 34.3 3 37.5 66 27.3 22 28.6 32 21.2 34 23.5
55–64 149 16.9 5 11.4 44 20.7 4 50.0 42 17.4 14 18.2 20 13.3 20 13.8
65+ 25 2.8 2 4.6 2 0.9 0 0.0 8 3.3 0 0.0 8 5.3 5 3.5
Sex
Male 812 93.8 42 100.0 203 95.8 8 100.0 213 91.0 74 96.1 140 94.0 132 91.7 0.144
Female 54 6.2 0.0 0.0 9 4.3 0 0.0 21 9.0 3 3.9 9 6.0 12 8.3
Specialty
Orthopaedics 625 71 35 79.6 178 83.6 5 62.5 151 62.4 54 71.1 115 75.7 87 60.0 < 0.001*
Neurosurgery 244 27.7 8 18.2 36 16.9 2 25.0 85 35.1 19 25.0 38 25.0 56 38.6
Trauma 102 11.6 5 11.4 18 8.5 0 0.0 54 22.3 9 11.8 2 1.3 14 9.7
Other 52 5.9 2 4.6 13 6.1 2 25.0 18 7.4 8 10.5 4 2.6 5 3.5
Practice type
Academic/private combined 198 22.5 13 29.6 29 13.6 4 50.0 47 19.4 28 36.4 23 15.1 54 37.2 < 0.001*
Academic 400 45.4 20 45.5 127 59.6 1 12.5 115 47.5 23 29.9 91 59.9 23 15.9
Private 142 16.1 7 15.9 26 12.2 1 12.5 20 8.3 15 19.5 30 19.7 43 29.7
Public/local hospital 137 15.6 4 9.1 30 14.1 2 25.0 59 24.4 11 14.3 7 4.6 24 16.6
Comorbidity
Obesity 102 15.6 7 24.1 23 15.5 0 0.0 26 13.9 16 31.4 8 6.3 22 20.8 < 0.001*
Hypertension 155 21.9 10 31.3 36 22.4 0 0.0 34 17.4 18 34.0 20 14.3 37 30.6 0.003*
Current tobacco use 75 11.9 2 8.3 32 20.4 0 0.0 23 12.5 7 16.7 2 1.6 9 9.7 < 0.001*
Respiratory illness 35 6.0 3 12.0 5 3.9 1 14.3 9 5.3 2 5.4 6 4.8 9 9.7 0.390
Renal disease 5 0.9 1 4.4 2 1.6 0 0.0 1 0.6 0 0.0 1 0.8 0 0.0 0.541
Cancer 4 0.7 0 0.0 2 1.6 0 0.0 1 0.6 0 0.0 1 0.8 0 0.0 0.878
Cardiac disease 25 4.3 3 12.0 4 3.1 1 14.3 7 4.2 2 5.4 3 2.4 5 5.6 0.300
Diabetes 44 7.4 5 18.5 19 13.2 0 0.0 3 1.8 9 20.5 2 1.6 6 6.7 < 0.001*
1 Comorbidity 250 31.1 15 40.5 68 35.2 2 25.0 65 28.8 31 47.0 24 16.7 45 34.9 < 0.001*
2 Comorbidities 63 10.2 6 21.4 15 10.7 0 0.0 12 6.9 10 22.2 6 4.8 14 14.3 0.003*
3+ Comorbidities 15 2.6 1 4.4 5 3.9 0 0.0 4 2.4 1 2.8 2 1.6 2 2.3 0.945
No comorbidities 553 62.8 22 50.0 125 58.7 6 75.0 161 66.5 35 45.5 120 79.0 84 57.9 < 0.001*

Calculation of p-values was performed using a combination of chi-square and Fisher exact tests.

* p < 0.05, statistical significance.

Table 2.
Medical comorbidities and association with COVID-19 perceptions
Variable Obesity
Hypertension
Current tobacco use
Respiratory illness
Renal disease
Cancer
Cardiac disease
Diabetes
1 Comorbidity
2 Comorbidities
3+ Comorbidities
No comorbidities
No. % p-value No. % p-value No. % p-value No. % p-value No. % p-value No. % p-value No. % p-value No. % p-value No. % p-value No. % p-value No. % p-value No. % p-value
COVID-19 diagnosis
Know someone diagnosed 41 14.2 0.519 72 22.5 0.469 35 12.4 0.356 16 6.1 0.562 1 0.4 0.916 1 0.4 0.916 9 3.5 0.621 15 5.7 0.345 112 31.1 0.573 26 9.5 0.517 6 2.4 0.798 248 63.3 0.792
Personally diagnosed 3 37.5 0.079 1 16.7 0.781 1 16.7 0.665 0 0.0 0.592 0 0.0 0.892 0 0.0 0.892 1 16.7 0.116 0 0.0 0.547 3 37.5 0.647 0 0.0 0.448 1 16.7 0.020* 5 55.6 0.608
COVID-19 testing
Know how to get tested 74 14.2 0.067 122 21.4 0.943 55 11.0 0.626 26 5.5 0.927 1 0.2 0.210 2 0.5 0.526 17 3.7 0.245 33 6.9 0.824 199 30.8 0.532 45 9.2 0.038* 10 2.2 0.548 447 63.8 0.699
Personally tested 6 13.0 0.641 7 14.9 0.254 1 2.4 0.065 3 7.0 0.648 0 0.0 0.688 0 0.0 0.688 2 4.8 0.824 2 4.8 0.590 13 24.5 0.339 4 9.1 0.776 0 0.0 0.307 40 70.2 0.277
Reason for testing
Direct contact with COVID-19 positive patient 4 30.8 0.448 6 27.3 0.210 1 10.0 0.050 1 25.0 0.503 - - - 1 2.7 0.242 3 7.7 0.696 2 5.3 0.492 8 18.2 0.013* 5 12.2 0.820 - - - 36 73.5 0.045
Prophylactic 2 15.4 0.300 1 4.6 0.679 2 20.0 0.158 0 0.0 0.585 - - - 0 0.0 0.784 1 14.3 0.387 1 14.3 0.481 5 45.5 0.328 1 14.3 0.799 - - - 6 50.0 0.357
Demonstrated symptoms 6 46.2 0.918 11 50.0 0.846 6 60.0 0.461 3 75.0 0.285 - - - 0 0.0 0.342 2 4.7 0.496 2 4.7 0.330 24 36.9 0.252 3 6.8 0.201 - - - 41 60.3 0.629
Ask to be tested 1 7.7 0.473 4 18.2 0.012* 1 10.0 0.329 0 0.0 0.704 - - - 0 0.0 0.849 0 0.0 0.642 2 40.0 0.005 4 57.1 0.148 2 40.0 0.038* - - - 3 33.3 0.063
Current stressors
Personal health 49 50.0 0.035* 78 53.1 0.002* 27 39.7 0.866 15 48.4 0.280 1 50.0 0.742 2 100.0 0.076 16 69.6 0.003* 17 7.6 0.541 110 47.0 0.030* 37 59.7 0.001* 5 38.5 0.989 206 57.5 0.003*
Family health 76 77.6 0.597 115 78.2 0.425 50 73.5 0.786 25 80.7 0.482 2 100.0 0.415 1 50.0 0.415 20 87.0 0.193 28 7.2 0.908 184 78.6 0.283 46 74.2 0.883 10 76.9 0.877 362 62.6 0.868
Community health 36 36.7 0.120 61 41.5 0.422 34 50.0 0.456 9 29.0 0.078 1 50.0 0.892 1 50.0 0.892 13 56.5 0.287 22 8.4 0.176 92 39.3 0.129 30 48.4 0.635 7 53.9 0.537 241 65.1 0.328
Hospital capacity 44 44.9 0.573 65 44.2 0.605 26 38.2 0.570 11 35.5 0.485 0 0.0 0.231 1 50.0 0.815 8 34.8 0.501 11 4.7 0.095 99 42.3 0.904 27 43.6 0.796 3 23.1 0.175 223 63.4 0.979
Timeline to resume clinical practice 41 41.8 0.218 55 37.4 0.016* 29 42.7 0.355 11 35.5 0.156 0 0.0 0.170 2 100.0 0.147 10 43.5 0.631 14 5.1 0.125 88 37.6 0.005* 23 37.1 0.086 8 61.5 0.356 259 68.5 0.005*
Government/leadership 19 19.4 0.988 22 15.0 0.227 13 19.1 0.968 7 22.6 0.656 0 0.0 0.489 0 0.0 0.489 6 26.1 0.424 6 5.5 0.545 36 15.4 0.192 12 19.4 0.995 3 23.1 0.735 103 66.9 0.308
Return to nonessential activities 11 11.2 0.450 22 15.0 0.784 10 14.7 0.888 4 12.9 0.855 0 0.0 0.567 2 100.0 0.001* 3 13.0 0.889 4 5.1 0.505 31 13.3 0.761 7 11.3 0.548 3 23.1 0.359 75 64.7 0.745
Economic issues 43 43.9 0.513 62 42.2 0.255 29 42.7 0.453 21 67.7 0.028* 0 0.0 0.180 1 50.0 0.943 13 56.5 0.395 13 4.9 0.088 95 40.6 0.079 32 51.6 0.536 5 38.5 0.520 253 65.7 0.182
Other 0 0.0 0.222 0 0.0 0.135 0 0.0 0.309 1 3.2 0.456 0 0.0 0.861 1 50.0 < 0.001* 0 0.0 0.554 1 11.1 0.607 3 1.3 0.814 0 0.0 0.331 0 0.0 0.656 8 72.7 0.514
Media perceptions
Accurate coverage 35 35.7 0.041* 73 50.0 0.394 35 51.5 0.881 13 41.9 0.416 1 50.0 0.775 1 100.0 0.590 9 39.1 0.601 18 6.5 0.691 119 51.3 0.052 26 41.9 0.595 3 23.1 0.180 259 63.6 0.181
Excessive coverage 53 54.1 54 37.0 21 30.9 14 45.2 1 50.0 0 0.0 10 43.5 12 6.3 88 37.9 23 37.1 7 53.9 180 60.4
Not enough coverage 18 18.4 19 13.0 12 17.7 4 12.9 0 0.0 0 0.0 4 17.4 9 8.7 25 10.8 13 21.0 3 23.1 94 69.6
Current media sources
International news - internet 22 25.0 0.663 30 21.0 0.023* 20 31.3 0.693 6 20.0 0.971 0 0.0 0.856 1 50.0 0.018* 1 4.6 0.082 9 6.4 0.110 58 27.1 0.496 10 16.4 0.005* 3 23.1 0.277 131 64.9 0.238
International news - television 8 9.1 17 11.9 5 7.8 3 10.0 0 0.0 0 0.0 3 13.6 3 6.4 17 7.9 11 18.0 0 0.0 44 61.1
National/local news - internet 25 28.4 29 20.3 20 31.3 11 36.7 1 50.0 0 0.0 6 27.3 6 3.8 55 25.7 11 18.0 5 38.5 153 68.3
National/local news - television 21 23.9 43 30.1 9 14.1 6 20.0 1 50.0 0 0.0 9 40.9 9 8.0 49 22.9 23 37.7 1 7.7 104 58.8
Newspaper 1 1.1 6 4.2 2 3.1 1 3.3 0 0.0 1 50.0 0 0.0 3 15.0 9 4.2 1 1.6 1 7.7 17 60.7
Social media 11 12.5 18 12.6 8 12.5 3 10.0 0 0.0 0 0.0 3 13.6 21 15.3 26 12.2 5 8.2 3 23.1 41 54.7
Quarantined 21 15.7 0.945 41.0 26.6 0.068 21 15.7 0.945 10.0 8.1 0.144 1 0.9 0.319 2 1.7 0.007* 3 2.6 0.350 12 9.6 0.159 60 34.7 0.149 16 12.4 0.396 4 3.4 0.402 113 58.6 0.101
Perception of hospital effectiveness
Acceptable/appropriate 46 52.3 0.216 86 60.1 0.570 31 48.4 0.188 18 60.0 0.283 0 0.0 0.141 2 100.0 0.750 12 54.6 0.430 24 7.3 0.406 136 63.6 0.758 31 50.8 0.322 6 46.2 0.464 304 63.7 0.772
Excessive/unnecessary 3 3.4 2 1.4 2 3.1 1 3.3 0 0.0 0 0.0 0 0.0 0 0.0 3 1.4 1 1.6 1 7.7 12 70.6
Disarray/disorganized 13 14.8 10 7.0 9 14.1 0 0.0 0 0.0 0 0.0 4 18.2 1 2.3 16 7.5 7 11.5 2 15.4 43 63.2
Not enough action 26 29.6 45 31.5 22 34.4 11 36.7 2 100.0 0 0.0 6 27.3 12 8.5 59 27.6 22 36.1 4 30.8 130 60.5
Perception of government effectiveness
Acceptable/appropriate 53 60.2 0.711 79 55.2 0.627 37 57.8 0.849 21 70.0 0.445 1 50.0 0.899 2 100.0 0.673 14 63.6 0.179 23 7.7 0.476 143 66.8 0.064 29 47.5 0.438 7 53.9 0.156 277 60.8 0.409
Excessive/unnecessary 1 1.1 4 2.8 3 4.7 0 0.0 0 0.0 0 0.0 0 0.0 0 0.0 4 1.9 2 3.3 0 0.0 14 70.0
Disarray/disorganized 11 12.5 22 15.4 7 10.9 3 10.0 0 0.0 0 0.0 5 22.7 2 3.5 22 10.3 6 9.8 4 30.8 56 63.6
Not enough action 23 26.1 38 26.6 17 26.6 6 20.0 1 50.0 0 0.0 3 13.6 12 7.7 45 21.0 24 39.3 2 15.4 144 67.0

Calculation of p-values was performed using a combination of chi-square and Fisher exact tests.

Comparisons are made between respondents with comorbidities and healthy individuals. Clinicians with no comorbidities were compared to those with one or more comorbidity. All percentages are calculated based upon the total number of responses received for each question and comorbidity combination.

COVID-19, coronavirus disease 2019.

* p < 0.05, statistical significance.

Table 3.
Medical comorbidities and association with clinical practice
Variable Obesity
Hypertension
Current tobacco use
Respiratory illness
Renal disease
Cancer
Cardiac disease
Diabetes
1 Comorbidity
2 Comorbidities
3+ Comorbidities
No comorbidities
No. % p-value No. % p-value No. % p-value No. % p-value No. % p-value No. % p-value No. % p-value No. % p-value No. % p-value No. % p-value No. % p-value No. % p-value
Still performing elective surgery 18 18.6 0.348 33 24.5 0.500 21 21.0 0.001* 1 1.3 0.060 0 0.0 0.543 0 0.0 0.543 4 4.8 0.749 10 11.2 0.087 56 41.5 0.003* 11 12.2 0.670 3 3.7 0.468 79 53.0 0.006*
Essential/emergency spine surgery 74 14.2 0.055 123 21.5 0.308 59 11.6 0.841 25 5.3 0.387 2 0.4 0.611 2 0.4 0.611 18 3.9 0.336 35 7.2 0.504 187 29.4 0.141 52 10.4 0.448 12 2.6 0.674 449 64.1 0.154
Impact on clinical time spent
Increased 3 3.3 0.283 10 6.9 0.889 5 7.6 0.865 2 6.5 0.829 0 0.0 0.832 0 0.0 0.832 1 4.6 0.809 0 0.0 0.181 12 5.4 0.587 3 4.8 0.878 1 7.7 0.492 30 65.2 0.703
Decreased 76 82.6 122 84.1 55 83.3 25 80.7 2 100.0 2 100.0 18 81.8 36 7.8 183 82.4 52 83.9 12 92.3 428 63.4
Stayed the same 13 14.1 13 9.0 6 9.1 4 12.9 0 0.0 0 0.0 3 13.6 2 3.9 27 12.2 7 11.3 0 0.0 49 59.0
Perceived impact on resident/fellow training
Not currently training residents/fellows 31 34.1 0.813 45 31.0 0.838 28 42.4 0.267 11 35.5 0.839 0 0.0 0.680 1 50.0 0.951 7 33.3 0.588 15 8.1 0.677 70 31.4 0.476 22 35.5 0.089 6 50.0 0.167 170 63.4 0.791
Hurts training experience 49 53.9 84 57.9 30 45.5 16 51.6 2 100.0 1 50.0 11 52.4 18 6.0 129 57.9 33 53.2 4 33.3 284 63.1
Improves training experience 4 4.4 6 4.1 2 3.0 2 6.5 0 0.0 0 0.0 2 9.5 2 10.0 6 2.7 6 9.7 0 0.0 18 60.0
No overall impact 7 7.7 10 6.9 6 9.1 2 6.5 0 0.0 0 0.0 1 4.8 3 10.0 18 8.1 1 1.6 2 16.7 27 56.3
Warning patients if the surgeon is COVID-19 positive
Absolutely 66 74.2 0.298 102 70.3 0.343 49 74.2 0.200 28 90.3 0.209 2 100.0 0.886 1 50.0 0.084 17 77.3 0.717 23 5.7 0.026* 160 72.4 0.380 41 67.2 0.369 11 84.6 0.134 383 64.4 0.273
Likely 8 9.0 21 14.5 6 9.1 3 9.7 0 0.0 0 0.0 3 13.6 6 8.0 27 12.2 10 16.4 0 0.0 69 65.1
Less likely 6 6.7 7 4.8 7 10.6 0 0.0 0 0.0 0 0.0 0 0.0 6 20.0 14 6.3 3 4.9 2 15.4 24 55.8
Not at all 9 10.1 15 10.3 4 6.1 0 0.0 0 0.0 1 50.0 2 9.1 3 8.8 20 9.1 7 11.5 0 0.0 31 53.5
Research activities impacted
No research engagement 31 36.5 0.091 42 29.4 0.006* 20 31.3 0.731 12 41.4 0.394 0 0.0 0.316 1 50.0 0.443 9 40.9 0.427 7 5.5 0.134 59 27.8 0.211 20 33.3 0.084 6 46.2 0.549 121 58.7 0.031*
Complete stop 13 15.3 19 13.3 12 18.8 4 13.8 1 50.0 0 0.0 2 9.1 10 11.5 35 16.5 8 13.3 2 15.4 77 63.1
Decrease in productivity 20 23.5 57 39.9 19 29.7 6 20.7 0 0.0 0 0.0 7 31.8 15 9.0 69 32.6 23 38.3 3 23.1 152 61.5
No change 15 17.7 21 14.7 7 10.9 3 10.3 1 50.0 0 0.0 3 13.6 4 5.8 34 16.0 8 13.3 1 7.7 65 60.2
Increase in productivity 6 7.1 4 2.8 6 9.4 4 13.8 0 0.0 1 50.0 1 4.6 1 1.6 15 7.1 1 1.7 1 7.7 63 78.8
Surgery Impact
Advise against 67 16.0 0.533 102 22.5 0.990 43 10.9 0.383 26.0 6.9 0.108 2 0.6 0.360 2 0.6 0.360 14 3.8 0.498 28 7.4 0.668 153 30.3 0.628 46 11.6 0.416 10 2.8 0.610 352 62.8 0.993
Proceed with standard precautions 15 20.3 0.971 25 22.3 0.668 16 32.7 0.051 4 14.8 0.479 0 0.0 0.474 0 0.0 0.474 1 6.7 0.190 4 4.7 0.347 49 28.5 0.036* 8 16.0 0.458 0 0.0 0.110 81 58.7 0.229
Absent during intubation/extubation 37 43.5 0.465 46 36.2 0.020* 19 32.8 0.030* 13 44.8 0.753 0 0.0 0.177 0 0.0 0.177 4 23.5 0.049* 13 5.6 0.348 76 38.8 0.033* 22 39.3 0.226 3 27.3 0.177 221 68.6 0.014*
Additional PPE during surgery 47 51.7 0.508 71 49.0 0.171 33 50.0 0.407 16 51.6 0.681 1 50.0 0.878 0 0.0 0.116 13 59.1 0.733 24 8.0 0.353 113 50.7 0.239 31 50.8 0.497 7 53.9 0.911 277 64.7 0.212

Calculation of p-values was performed using a combination of chi-square and Fisher exact tests.

Comparisons are made between respondents with comorbidities and healthy individuals. Clinicians with no comorbidities were compared to those with one or more comorbidity. All percentages are calculated based upon the total number of responses received for each question and comorbidity combination.

COVID-19, coronavirus disease 2019; PPE, personal protective equipment.

* p < 0.05, statistical significance.

Table 4.
Medical comorbidities and future perceptions
Variable Obesity
Hypertension
Current tobacco use
Respiratory illness
Renal disease
Cancer
Cardiac disease
Diabetes
1 Comorbidity
2 Comorbidities
3+ Comorbidities
No comorbidities
No. % p-value No. % p-value No. % p-value No. % p-value No. % p-value No. % p-value No. % p-value No. % p-value No. % p-value No. % p-value No. % p-value No. % p-value
Belief that future guidelines are needed
Yes 81 97.6 0.525 130 94.9 0.595 57 90.5 0.336 25 89.3 0.187 2 100.0 0.948 2 100.0 0.948 21 95.5 0.932 35 7.3 0.008* 195 93.8 0.309 55 96.5 0.418 12 92.3 0.825 448 63.1 0.313
No 0 0.0 2 1.5 1 1.6 1 3.6 0 0.0 0 0.0 0 0.0 2 40.0 4 1.9 1 1.8 0 0.0 3 37.5
Unsure 2 2.4 5 3.7 5 7.9 2 7.1 0 0.0 0 0.0 1 4.6 0 0.0 9 4.3 1 1.8 1 7.7 21 65.6
Perceived impact in 1 year
No change 13 13.4 0.643 24 22.2 0.948 11 11.6 0.953 6 6.7 0.623 0 0.0 0.511 0 0.0 0.511 5 5.6 0.553 7 7.7 0.859 40 32.3 0.647 4 4.6 0.040* 5 5.6 0.057 84 63.2 0.963
Heighted awareness of hygiene 50 79.4 0.828 73 78.5 0.941 31 75.6 0.711 14 70.0 0.394 2 100.0 0.455 2 100.0 0.455 12 70.6 0.464 23 7.4 0.883 105 73.9 0.313 37 90.2 0.069 7 63.6 0.255 286 65.8 0.717
Increase use of PPE 47 61.0 0.060 67 55.8 0.214 30 58.8 0.204 12 48.0 0.892 2 100.0 0.153 2 100.0 0.153 12 60.0 0.354 18 8.0 0.455 98 56.0 0.143 35 66.0 0.022* 5 41.7 0.597 206 59.9 0.045*
Ask patients to reschedule if sick 40 50.6 0.064 53 41.4 0.698 28 49.1 0.164 11 42.3 0.776 2 100.0 0.081 1 50.0 0.762 10 47.6 0.458 13 7.0 0.784 81 42.6 0.462 24 44.4 0.484 7 53.9 0.298 173 60.7 0.291
Increase nonoperative measures prior to surgery 19 24.1 0.163 38 28.8 0.004* 20 33.9 0.003* 5 19.2 0.816 1 50.0 0.228 1 50.0 0.228 6 27.3 0.241 10 11.4 0.101 52 26.9 0.006* 17 30.4 0.020* 3 23.1 0.600 78 52.0 0.002*
Increase digital options for communication 39 47.0 0.404 46 33.6 0.074 24 38.1 0.547 13 46.4 0.650 2 100.0 0.098 1 50.0 0.821 5 22.7 0.072 18 8.3 0.436 91 43.8 0.683 19 33.3 0.205 5 38.5 0.795 199 63.4 0.850
How likely to attend a conference in 1 year
Likely 54 65.1 0.232 90 66.2 0.626 39 61.9 0.490 19 67.9 0.997 2 100.0 0.627 1 50.0 0.678 13 59.1 0.004* 21 6.1 0.325 132 63.8 0.384 34 59.7 0.341 9 69.2 0.478 321 64.7 0.295
Not likely 3 3.6 8 5.9 7 11.1 2 7.1 0 0.0 0 0.0 6 27.3 3 7.9 14 6.8 4 7.0 2 15.4 35 63.6
Unsure 26 31.3 38 27.9 17 27.0 7 25.0 0 0.0 1 50.0 3 13.6 13 10.2 61 29.5 19 33.3 2 15.4 115 58.4
Timeframe to resume elective surgery
< 2 Weeks 5 5.5 0.720 5 3.5 0.279 4 6.1 0.399 0 0.0 0.396 0 0.0 0.850 0 0.0 0.843 3 13.6 0.058 1 6.3 0.902 14 6.3 0.175 2 3.3 0.359 0 0.0 0.923 15 48.4 0.178
2–4 Weeks 16 17.6 29 20.1 9 13.6 6 19.4 0 0.0 1 50.0 3 13.6 8 8.8 41 18.5 9 14.8 3 23.1 83 61.0
1–2 Months 15 16.5 24 16.7 8 12.1 4 12.9 0 0.0 0 0.0 1 4.6 5 5.5 29 13.1 10 16.4 2 15.4 86 67.7
> 2 Months 3 3.3 4 2.8 2 3.0 0 0.0 0 0.0 0 0.0 0 0.0 2 8.0 9 4.1 1 1.6 0 0.0 23 69.7
No current stoppage 11 12.1 21 14.6 10 15.2 1 3.2 0 0.0 0 0.0 3 13.6 5 9.6 26 11.7 11 18.0 1 7.7 47 55.3
Unknown 41 45.1 61 42.4 33 50.0 20 64.5 2 100.0 1 50.0 12 54.6 17 6.3 103 46.4 28 45.9 7 53.9 254 64.8
Anticipated # weeks to resume baseline activity
< 2 Weeks 10 11.8 0.450 13 9.3 0.041* 10 15.6 0.805 1 3.5 0.403 0 0.0 0.307 0 0.0 0.160 3 13.6 0.216 3 4.4 0.082 24 11.5 0.126 6 10.0 0.267 1 7.7 0.876 65 67.7 0.039*
2–4 Weeks 24 28.2 43 30.7 15 23.4 9 31.0 0 0.0 0 0.0 8 36.4 12 11.1 58 27.8 19 31.7 4 30.8 96 54.2
4–6 Weeks 19 22.4 34 24.3 15 23.4 6 20.7 0 0.0 2 100.0 5 22.7 13 10.6 49 23.4 15 25.0 3 23.1 110 62.2
6–8 Weeks 13 15.3 21 15.0 10 15.6 5 17.2 0 0.0 0 0.0 0 0.0 3 4.3 32 15.3 7 11.7 2 15.4 67 62.0
> 8 Weeks 19 22.4 29 20.7 14 21.9 8 27.6 2 100.0 0 0.0 6 27.3 6 4.1 46 22.0 13 21.7 3 23.1 139 69.2
% Telecommunication clinical visits/wk
0–25 51 55.4 0.355 77 53.1 0.147 42 63.6 0.025* 18 58.1 0.326 1 50.0 0.845 0 0.0 0.168 9 40.9 0.599 20 7.7 0.009* 112 50.2 0.323 36 59.0 0.047* 9 69.2 0.389 241 60.6 0.068
26–50 11 12.0 26 17.9 11 16.7 2 6.5 0 0.0 0 0.0 4 18.2 11 14.1 38 17.0 12 19.7 1 7.7 67 56.8
51–75 5 5.4 12 8.3 4 6.1 1 3.2 0 0.0 0 0.0 4 18.2 2 3.6 18 8.1 5 8.2 0 0.0 54 70.1
76–100 25 27.2 30 20.7 9 13.6 10 32.3 1 50.0 2 100.0 5 22.7 4 2.7 55 24.7 8 13.1 3 23.1 142 68.3

Calculation of p-values was performed using a combination of chi-square and Fisher exact tests.

Comparisons are made between respondents with comorbidities and healthy individuals. Clinicians with no comorbidities were compared to those with one or more comorbidity. All percentages are calculated based upon the total number of responses received for each question and comorbidity combination.

PPE, personal protective equipment.

* p < 0.05, statistical significance.

Table 5.
Multivariate assessment of medical comorbidities & COVID-19 survey responses
Assessed survey responses Age
Female sex
Orthopaedics
Neurosurgery
Trauma
Academic Practice
Private practice
Public/local practice
Obese
Hypertension
Current tobacco use
Respiratory illness
Cardiac disease
Diabetes
OR 95% CI p-value OR 95% CI p-value OR 95% CI p-value OR 95% CI p-value OR 95% CI p-value OR 95% CI p-value OR 95% CI p-value OR 95% CI p-value OR 95% CI p-value OR 95% CI p-value OR 95% CI p-value OR 95% CI p-value OR 95% CI p-value OR 95% CI p-value
Reasons for COVID-19 testing
Personally tested for COVID-19 0.99 0.74–1.33 0.962 2.56 1.04–6.29 0.041* 2.71 0.55–13.27 0.219 3.47 0.72–16.71 0.121 1.98 0.91–4.28 0.083 1.35 0.69–2.65 0.386 0.42 0.13–1.34 0.143 0.55 0.19–1.55 0.259 1.06 0.43–2.59 0.902 0.79 0.33–1.89 0.603 0.18 0.02–1.33 0.093 1.05 0.23–4.76 0.949 1.93 0.41–9.09 0.404 0.85 0.19–3.79 0.834
Direct contact with COVID-19 positive patient 1.03 0.70–1.51 0.873 0.82 0.20–3.34 0.782 0.21 0.02–2.43 0.210 0.30 0.03–3.51 0.340 1.76 0.51–6.14 0.374 1.11 0.41–3.03 0.835 1.64 0.41–6.59 0.488 1.89 0.53–6.74 0.324 0.50 0.13–1.98 0.325 0.59 0.18–1.88 0.370 0.14 0.02–1.20 0.073 0.75 0.06–10.04 0.825 2.04 0.33–12.61 0.441 1.03 0.17–6.23 0.971
Prophylactic 3.05 1.22–7.63 0.017* 1.00 1.00–1.00 - 108.44 0.85–13,777.31 0.058 126.17 0.92–17289.75 0.054 18.97 2.39–150.68 0.005* 0.92 0.17–4.99 0.919 0.07 0.00–6.09 0.247 0.07 0.00–1.51 0.090 3.79 0.49–29.12 0.200 0.18 0.01–2.27 0.183 9.90 1.10–89.14 0.041* 1.00 1.00–1.00 - 0.54 .01–42.62 0.780 1.26 0.09–18.54 0.866
Demonstrated symptoms 0.82 0.56–1.18 0.280 1.46 0.40–5.28 0.564 2.00 0.23–17.69 0.532 1.38 0.16–12.01 0.770 0.32 0.08–1.17 0.085 0.82 0.32–2.08 0.670 0.93 0.24–3.59 0.918 0.72 0.21–2.45 0.604 1.21 0.33–4.37 0.772 1.42 0.48–4.22 0.526 1.73 0.44–6.86 0.433 3.46 0.25–46.99 0.352 0.47 0.07–3.03 0.428 0.35 0.06–2.14 0.258
Ask to be tested 0.70 0.29–1.69 0.430 3.53 0.28–44.17 0.328 - - - - - - 1.00 1.00–1.00 - 1.49 0.14–15.86 0.741 1.00 1.00–1.00 - 6.48 0.41–102.85 0.185 2.36 0.17–32.46 0.522 7.55 0.99–57.45 0.051 1.75 0.13–22.97 0.672 1.00 1.00–1.00 - 1.00 1.00–1.00 - 3.58 0.38–34.15 0.267
Current stressors
Personal health 1.10 0.95–1.28 0.199 0.72 0.39–1.35 0.307 0.59 0.26–1.32 0.196 0.69 0.30–1.57 0.379 1.11 0.70–1.77 0.657 0.97 0.68–1.38 0.855 0.73 0.47–1.16 0.185 1.26 0.79–2.03 0.335 1.33 0.86–2.07 0.199 1.50 1.01–2.23 0.046* 0.81 0.48–1.37 0.428 1.55 0.72–3.34 0.264 2.49 0.98–6.30 0.055 0.81 0.41–1.59 0.531
Family health 1.16 0.94–1.43 0.168 0.29 0.15–0.56 < 0.001* 1.23 0.43–3.50 0.699 1.45 0.50–4.25 0.494 1.24 0.65–2.35 0.513 1.12 0.69–1.81 0.644 1.23 0.65–2.33 0.521 1.00 0.53–1.86 0.988 1.24 0.65–2.38 0.515 0.95 0.55–1.67 0.869 0.52 0.28–0.97 0.039* 1.69 0.48–5.96 0.412 1.15 0.32–4.12 0.834 0.79 0.33–1.93 0.609
Community health 0.96 0.83–1.12 0.627 1.14 0.63–2.06 0.675 2.31 1.00–5.34 0.050 2.12 0.91–4.97 0.082 1.77 1.11–2.81 0.017* 0.71 0.50–1.01 0.058 0.91 0.58–1.42 0.665 0.67 0.42–1.08 0.102 0.65 0.42–1.03 0.066 0.89 0.60–1.33 0.578 1.41 0.84–2.37 0.189 0.48 0.20–1.11 0.087 1.94 0.81–4.67 0.139 1.89 0.97–3.71 0.063
Hospital capacity 0.97 0.83–1.12 0.662 1.15 0.63–2.11 0.644 1.08 0.48–2.44 0.852 1.18 0.52–2.69 0.700 1.63 1.02–2.59 0.041* 1.42 1.00–2.03 0.053 0.61 0.38–0.99 0.044* 2.28 1.42–3.68 0.001* 1.28 0.82–2.00 0.284 1.39 0.92–2.08 0.114 0.75 0.44–1.29 0.298 0.97 0.43–2.15 0.932 0.71 0.28–1.79 0.470 0.51 0.24–1.06 0.071
Timeline to resume clinical practice 0.94 0.81–1.08 0.371 1.45 0.80–2.62 0.217 1.06 0.48–2.32 0.887 0.96 0.43–2.14 0.928 0.95 0.60–1.51 0.837 0.94 0.66–1.33 0.716 1.12 0.72–1.74 0.622 0.70 0.43–1.12 0.133 0.89 0.57–1.38 0.591 0.77 0.52–1.15 0.209 0.95 0.56–1.59 0.838 0.56 0.25–1.26 0.158 1.20 0.50–2.85 0.685 0.77 0.38–1.52 0.447
Government/leadership 0.94 0.78–1.13 0.507 2.05 1.08–3.91 0.028* 2.19 0.76–6.29 0.145 1.79 0.62–5.15 0.278 0.98 0.55–1.74 0.945 1.57 0.97–2.54 0.068 1.48 0.82–2.68 0.198 1.47 0.79–2.72 0.226 1.14 0.66–1.97 0.647 0.85 0.50–1.46 0.565 0.85 0.50–1.46 0.565 1.16 0.45–2.96 0.758 1.81 0.67–4.88 0.241 0.84 0.34–2.12 0.716
Return to nonessential activities 1.01 0.82–1.25 0.923 1.33 0.61–2.89 0.470 1.35 0.46–3.99 0.586 1.13 0.38–3.39 0.829 1.77 0.99–3.17 0.052 1.66 0.96–2.86 0.067 1.70 0.88–3.29 0.117 1.29 0.63–2.64 0.493 0.75 0.38–1.48 0.407 1.32 0.76–2.30 0.324 1.32 0.76–2.30 0.324 1.04 0.35–3.09 0.945 0.89 0.25–3.18 0.858 0.66 0.22–1.94 0.448
Economic issues 0.85 0.73–0.99 0.032* 0.70 0.38–1.30 0.262 1.78 0.77 ,4.07 0.175 1.70 0.73–3.93 0.216 0.95 0.59–1.51 0.823 0.55 0.38–0.78 0.001* 1.26 0.80–1.98 0.314 0.51 0.31–0.82 0.006* 0.81 0.52–1.27 0.359 0.87 0.58–1.312 0.514 0.87 0.58–1.31 0.514 2.97 1.27–6.96 0.012* 1.86 0.77–4.50 0.170 0.61 0.30–1.26 0.184
Clinical practice
Quarantine 1.03 0.86–1.23 0.735 2.07 1.08–3.95 0.028* 1.35 0.52–3.52 0.542 2.28 0.87–5.98 0.094 0.80 0.44–1.47 0.472 0.66 0.44–1.00 0.049* 0.91 0.55–1.52 0.731 0.54 0.30–0.97 0.038* 0.83 0.48–1.41 0.483 1.29 0.82–2.04 0.277 1.29 0.82–2.04 0.277 1.88 0.84–4.24 0.127 0.42 0.11–1.56 0.196 1.56 0.74–3.27 0.240
Still performing elective surgery 1.13 0.93–1.37 0.218 0.44 0.15–1.27 0.128 1.23 0.40 ,3.83 0.718 0.78 0.25–2.45 0.665 0.32 0.14–0.72 0.006* 2.18 1.33–3.55 0.002* 0.82 0.40–1.66 0.575 1.56 0.80–3.04 0.191 1.17 0.65–2.09 0.604 1.24 0.76–2.02 0.396 1.24 0.76–2.02 0.396 0.16 0.02–1.22 0.077 0.92 0.29–2.91 0.887 1.26 0.57–2.77 0.569
Essential/emergency spine surgery 0.91 0.73–1.14 0.407 0.52 0.24–1.14 0.103 1.44 0.45–4.63 0.536 2.22 0.66–7.44 0.196 0.77 0.40–1.49 0.446 2.35 1.33–4.15 0.003* 0.79 0.43–1.45 0.446 0.82 0.43–1.57 0.556 0.61 0.33–1.12 0.113 0.88 0.48–1.59 0.663 0.88 0.48–1.59 0.663 0.69 0.25–1.93 0.477 0.97 0.30–3.18 0.962 1.90 0.55–6.58 0.310
Advise against 1.01 0.85–1.19 0.940 0.79 0.42–1.51 0.475 0.74 0.29–1.87 0.524 0.52 0.21–1.33 0.174 1.57 0.90–2.74 0.113 0.82 0.55–1.21 0.323 1.73 0.99–3.03 0.054 0.64 0.39–1.08 0.094 1.15 0.69–1.92 0.598 0.89 0.58–1.38 0.605 0.89 0.58–1.38 0.605 1.90 0.70–5.12 0.205 0.60 0.24–1.53 0.288 1.20 0.56–2.58 0.642
Proceed with standard precautions 1.11 0.91–1.35 0.265 0.26 0.08–0.87 0.067 1.15 0.41 ,3.26 0.583 1.46 0.51–4.18 0.287 1.66 0.94–2.93 0.244 0.95 0.60–1.51 0.936 0.65 0.34–1.27 0.114 1.40 0.77–2.53 0.234 0.92 0.50–1.69 0.795 1.07 0.64–1.81 0.604 1.07 0.64–1.81 0.604 0.85 0.29–2.55 0.543 0.19 0.03–1.49 0.133 0.53 0.18–1.56 0.176
Absent during intubation/extubation 0.84 0.72–0.98 0.076 0.73 0.39–1.36 0.805 0.80 0.33–1.89 0.966 0.84 0.35–2.04 0.974 1.03 0.64–1.66 0.618 1.27 0.88–1.84 0.135 1.04 0.65–1.68 0.825 1.22 0.74–2.00 0.191 1.11 0.70–1.77 0.751 0.76 0.50–1.16 0.307 0.76 0.50–1.16 0.307 1.00 0.45–2.22 0.980 0.42 0.14–1.29 0.268 0.96 0.47–1.97 0.974
Additional PPE during surgery 0.91 0.78–1.06 0.214 1.51 0.81–2.84 0.198 1.55 0.67–3.63 0.307 2.00 0.84–4.72 0.115 0.86 0.54–1.37 0.525 1.20 0.84–1.71 0.319 0.72 0.45–1.13 0.155 1.27 0.78–2.06 0.336 0.94 0.60–1.48 0.786 0.85 0.57–1.27 0.420 0.85 0.57–1.27 0.420 0.87 0.40–1.87 0.720 1.66 0.67–4.13 0.273 1.76 0.87–3.55 0.114
% Telecommunication clinical visits/wk 0.94 0.81–1.08 0.380 1.69 0.95–3.01 0.077 0.68 0.32–1.46 0.328 0.85 0.40–1.84 0.689 0.99 0.64–1.54 0.972 1.78 1.27–2.49 0.001* 1.08 0.70–1.67 0.732 0.71 0.44–1.14 0.153 0.97 0.63–1.49 0.874 0.88 0.61–1.27 0.489 0.88 0.61–1.27 0.489 0.89 0.42–1.91 0.768 1.67 0.76–3.66 0.200 0.67 0.36–1.26 0.218
Perceived impact in 1 year
No change 1.08 0.88–1.33 0.449 0.69 0.29–1.64 0.403 0.98 0.33–2.89 0.974 1.15 0.38–3.42 0.806 0.98 0.51–1.86 0.943 1.53 0.90–2.60 0.117 1.41 0.73–2.73 0.309 2.67 1.42–5.03 0.002* 0.84 0.44–1.60 0.591 0.93 0.54–1.61 0.808 0.93 0.54–1.61 0.808 1.57 0.60–4.07 0.358 1.24 0.43–3.58 0.695 1.13 0.47–2.71 0.789
Heighted awareness of hygiene 0.89 0.76–1.04 0.292 1.23 0.65–2.33 0.427 1.58 0.68–3.69 0.790 1.59 0.67–3.76 0.984 1.05 0.64–1.72 0.964 0.77 0.52–1.12 0.149 0.65 0.40–1.06 0.207 0.43 0.26–0.72 0.001* 1.20 0.74–1.96 0.604 0.81 0.53–1.23 0.676 0.81 0.53–1.23 0.676 0.76 0.34–1.71 0.273 1.14 0.47–2.78 0.713 1.30 0.64–2.64 0.946
Increase use of PPE 0.92 0.79–1.08 0.318 0.98 0.53–1.83 0.950 0.84 0.36–1.93 0.678 1.23 0.53–2.87 0.625 1.06 0.65–1.72 0.828 0.68 0.47–0.99 0.042* 0.49 0.30–0.79 0.004* 0.61 0.37–1.00 0.051 1.51 0.94–2.44 0.089 1.14 0.75–1.74 0.527 1.14 0.75–1.74 0.835 0.86 0.38–1.97 0.727 1.58 0.65–3.85 0.315 1.05 0.52–2.10 0.893
Ask patients to reschedule if sick 1.17 0.99–1.37 0.026* 1.00 0.53–1.89 0.938 0.85 0.37–1.97 0.883 0.97 0.42–2.28 0.938 1.28 0.78–2.09 0.240 0.99 0.68–1.45 0.932 0.99 0.61–1.61 0.912 1.07 0.65–1.77 0.816 1.53 0.95–2.46 0.111 0.87 0.57–1.34 0.442 0.87 0.57–1.34 0.442 1.01 0.44–2.30 0.931 1.14 0.47–2.77 0.909 0.81 0.40–1.67 0.491
Increase nonoperative measures prior to surgery 0.98 0.80–1.20 0.994 1.45 0.70–3.02 0.291 0.74 0.28–1.94 0.709 1.01 0.38–2.70 0.822 1.27 0.71–2.30 0.381 0.83 0.53–1.31 0.490 0.55 0.29–1.04 0.071 0.88 0.48–1.60 0.622 1.00 0.56–1.80 0.976 1.59 0.97–2.61 0.085 1.59 0.97–2.61 0.085 0.71 0.23–2.18 0.516 1.48 0.54–4.08 0.529 1.35 0.61–2.97 0.467
Increase digital options for communication 1.14 0.97–1.34 0.112 1.34 0.72–2.49 0.352 1.07 0.46–2.52 0.871 1.36 0.57–3.22 0.491 1.14 0.70–1.87 0.591 1.08 0.74–1.57 0.685 0.67 0.41 ,1.09 0.107 0.80 0.49–1.33 0.393 1.39 0.86–2.25 0.180 0.58 0.38–0.90 0.015* 0.58 0.38–0.90 0.015* 0.97 0.42–2.25 0.949 0.42 0.15–1.20 0.105 1.57 0.78–3.16 0.210
Other perceptions
Media perceptions 1.02 0.89–1.17 0.810 0.59 0.33–1.05 0.071 0.57 0.28–1.19 0.133 0.75 0.36–1.58 0.455 1.30 0.84–2.01 0.244 1.17 0.84–1.63 0.353 1.23 0.81–1.87 0.340 1.17 0.75–1.83 0.492 1.28 0.84–1.96 0.248 1.20 0.83–1.73 0.345 1.20 0.83–1.73 0.345 1.44 0.69–2.98 0.329 1.10 0.48–2.54 0.815 0.66 0.35–1.25 0.204
Perception of hospital effectiveness 1.51 1.29–1.77 < 0.001* 0.61 0.34–1.10 0.103 1.47 0.62–3.46 0.381 1.17 0.49–2.80 0.724 1.28 0.78–2.09 0.335 1.98 1.38–2.85 < 0.001* 2.01 1.25–3.23 0.004* 1.00 0.62–1.60 0.994 0.72 0.46–1.14 0.162 0.72 0.48–1.08 0.108 0.72 0.48–1.08 0.108 1.23 0.57–2.67 0.601 0.46 0.19–1.10 0.083 1.05 0.53–2.09 0.883
Perception of government effectiveness 1.19 1.02–1.38 0.024* 0.61 0.34–1.08 0.088 0.87 0.41 ,1.88 0.728 0.80 0.37–1.74 0.570 1.17 0.73–1.87 0.511 1.13 0.79–1.61 0.496 1.12 0.71–1.78 0.626 0.85 0.53–1.36 0.498 0.99 0.63–1.55 0.961 0.67 0.45–0.99 0.047* 0.67 0.45–0.99 0.047* 1.59 0.71–3.57 0.259 0.76 0.31–1.85 0.550 1.08 0.56–2.07 0.828
Warning patients if the surgeon is COVID-19 positive 1.46 1.22–1.74 < 0.001* 0.82 0.43–1.59 0.564 1.34 0.52–3.44 0.548 1.76 0.67–4.65 0.255 1.10 0.65–1.87 0.709 0.57 0.37–0.88 0.010* 0.87 0.49–1.54 0.633 0.55 0.32–0.96 0.037* 0.88 0.52–1.49 0.629 0.58 0.37–0.91 0.017* 0.58 0.37–0.91 0.017* 5.23 1.20–22.83 0.028* 0.96 0.33–2.79 0.940 0.50 0.25–0.99 0.048*

COVID-19, coronavirus disease 2019; OR, odds ratio; CI, confidence interval; PPE, personal protective equipment.

All multivariate models were assessed using the same set of independent factors and included baseline demographics, practice-specific variables, and medical comorbidities. Renal disease and cancer were excluded from assessment due to low study prevalence.

Multivariate logistic regression was used to assess survey responses with simple binary outcomes where ordinal logistic regression was implemented for questions with ordinal scales.

* p < 0.05, statistical significance.

Table 6.
Multivariate assessment of number of medical comorbidities and COVID-19 survey responses
Assessed survey responses Age
Female sex
Orthopaedics
Neurosurgery
Trauma
Academic Practice
Private practice
Public/local practice
Number of comorbidities
OR 95% CI p-value OR 95% CI p-value OR 95% CI p-value OR 95% CI p-value OR 95% CI p-value OR 95% CI p-value OR 95% CI p-value OR 95% CI p-value OR 95% CI p-value
Reasons for COVID-19 testing
Personally tested for COVID-19 1.02 0.76–1.35 0.917 2.47 1.01–6.00 0.047* 2.51 0.56–11.29 0.230 3.06 0.69–13.50 0.140 1.95 0.91–4.18 0.087 1.32 0.68–2.59 0.413 0.45 0.14–1.40 0.168 0.58 0.21–1.62 0.298 0.80 0.51–1.28 0.357
Direct contact with COVID-19 positive patient 1.05 0.72–1.51 0.804 0.78 0.20–3.02 0.723 0.31 0.03–3.37 0.339 0.39 0.04–4.13 0.432 1.64 0.50–5.31 0.412 1.11 0.42–2.94 0.830 1.86 0.48–7.22 0.368 1.85 0.54–6.29 0.328 0.70 0.38–1.28 0.244
Prophylactic 2.04 1.01–4.13 0.048* 1.00 1.00–1.00 - 44.29 0.80–2446.18 0.064 57.56 1.10–3012.99 0.045* 11.98 1.78–80.77 0.011* 0.65 0.13–3.16 0.592 0.08 0.00–3.43 0.187 0.12 0.01–1.82 0.125 1.26 0.45–3.54 0.662
Demonstrated symptoms 0.81 0.57–1.15 0.246 1.59 0.45–5.61 0.472 1.56 0.19–12.63 0.677 1.24 0.15–9.89 0.842 0.41 0.12–1.39 0.154 0.84 0.34–2.09 0.710 0.88 0.24–3.26 0.849 0.69 0.21–2.30 0.549 0.99 0.57–1.73 0.971
Ask to Be Tested 0.98 0.47–2.05 0.954 2.82 0.25–32.26 0.405 - - - - - - 1.00 1.00–1.00 - 2.11 0.22–20.13 0.516 1.00 1.00–1.00 - 3.79 0.27–53.95 0.326 2.70 0.98–7.41 0.054
Current Stressors
Personal health 1.12 0.97–1.29 0.123 0.73 0.39–1.35 0.313 0.60 0.27–1.34 0.211 0.70 0.31–1.57 0.387 1.11 0.70–1.77 0.647 0.95 0.67–1.36 0.795 0.77 0.49–1.21 0.259 1.27 0.79–2.03 0.320 1.32 1.07–1.63 0.009*
Family health 1.18 0.96–1.44 0.114 0.29 0.15–0.57 < 0.001* 1.35 0.47–3.90 0.579 1.56 0.52–4.64 0.425 1.29 0.68–2.44 0.440 1.09 0.68–1.77 0.711 1.28 0.68–2.41 0.444 0.99 0.53–1.84 0.970 0.89 0.68–1.18 0.421
Community health 0.98 0.85–1.13 0.821 1.12 0.62–2.02 0.714 2.25 0.98–5.14 0.056 2.02 0.87–4.68 0.102 1.74 1.10–2.76 0.018* 0.73 0.51–1.03 0.074 0.88 0.57–1.37 0.576 0.70 0.44–1.12 0.135 1.01 0.82–1.24 0.941
Hospital capacity 0.98 0.84–1.13 0.747 1.15 0.63–2.09 0.650 1.07 0.48–2.40 0.868 1.18 0.52–2.67 0.693 1.60 1.01–2.54 0.045* 1.39 0.97–1.98 0.071 0.62 0.38–1.00 0.049* 2.19 1.37–3.51 0.001* 1.02 0.82–1.26 0.880
Timeline to resume clinical practice 0.94 0.81–1.08 0.358 1.44 0.80–2.60 0.227 1.04 0.47–2.29 0.917 0.95 0.43–2.11 0.898 0.96 0.61–1.52 0.876 0.94 0.66–1.33 0.721 1.11 0.72–1.72 0.640 0.71 0.44–1.14 0.160 0.83 0.68–1.03 0.087
Government/leadership 0.93 0.78–1.12 0.456 2.04 1.07–3.89 0.029* 2.22 0.76–6.46 0.144 1.83 0.63–5.33 0.268 1.00 0.56–1.78 0.990 1.57 0.97–2.54 0.066 1.52 0.84–2.75 0.165 1.53 0.82–2.82 0.178 1.02 0.78–1.33 0.894
Return to nonessential activities 1.03 0.84–1.25 0.809 1.34 0.62–2.90 0.461 1.32 0.44–3.89 0.620 1.12 0.37–3.36 0.846 1.75 0.98–3.12 0.057 1.65 0.96–2.84 0.069 1.67 0.87–3.23 0.125 1.26 0.61–2.57 0.532 1.02 0.76–1.38 0.884
Economic issues 0.85 0.74–0.98 0.029* 0.72 0.39–1.33 0.296 1.77 0.78–4.03 0.170 1.71 0.75–3.92 0.206 0.97 0.61–1.54 0.890 0.55 0.39–0.78 0.001* 1.31 0.84–2.05 0.229 0.53 0.33–0.84 0.008* 0.92 0.75–1.14 0.457
Clinical Practice
Quarantine 1.02 0.86–1.21 0.786 2.10 1.10–4.01 0.025* 1.34 0.52–3.44 0.541 2.29 0.89–5.91 0.086 0.78 0.43–1.43 0.429 0.67 0.45–1.01 0.056 0.89 0.54–1.47 0.645 0.52 0.29–0.93 0.028* 1.19 0.94–1.51 0.143
Still performing elective surgery 1.10 0.91–1.32 0.324 0.44 0.15–1.28 0.131 1.13 0.35–3.64 0.836 0.74 0.23–2.42 0.620 0.33 0.14–0.74 0.007* 2.21 1.36–3.59 0.001* 0.77 0.38–1.55 0.466 1.61 0.83–3.12 0.156 1.32 1.02–1.71 0.032*
Essential/emergency spine surgery 0.92 0.74–1.14 0.453 0.51 0.24–1.12 0.096 1.41 0.45–4.35 0.555 2.15 0.66–7.00 0.202 0.75 0.39–1.44 0.392 2.37 1.35–4.18 0.003* 0.76 0.42–1.38 0.364 0.82 0.44–1.54 0.539 0.91 0.68–1.24 0.558
Advise against 0.99 0.84–1.16 0.856 0.80 0.42–1.52 0.498 0.77 0.30–1.97 0.584 0.54 0.21–1.40 0.208 1.57 0.90–2.73 0.113 0.82 0.56–1.22 0.329 1.74 1.00–3.03 0.051 0.64 0.38–1.06 0.082 0.99 0.79–1.25 0.966
Proceed with standard precautions 1.07 0.89–1.30 0.393 0.26 0.08–0.88 0.065 1.10 0.39–3.10 0.691 1.47 0.52–4.21 0.308 1.63 0.93–2.87 0.247 0.95 0.60–1.51- 0.946 0.63 0.32–1.21 0.090 1.37 0.76–2.47 0.242 0.96 0.73–1.27 0.879
Absent during intubation/extubation 0.83 0.72–0.97 0.059 0.72 0.39–1.34 0.767 0.84 0.36–1.96 0.961 0.89 0.38–2.10 0.927 1.03 0.64–1.65 0.611 1.27 0.88–1.83 0.139 1.06 0.66–1.70 0.850 1.20 0.73–1.95 0.222 0.78 0.62–0.97 0.060
Additional PPE during surgery 0.93 0.80–1.07 0.298 1.49 0.79–2.79 0.217 1.61 0.69–3.75 0.269 2.00 0.85–4.72 0.114 0.86 0.54–1.38 0.533 1.20 0.84 ,1.71 0.315 0.72 0.46–1.14 0.164 1.29 0.79–2.08 0.307 0.95 0.77–1.17 0.637
% Telecommunication clinical visits/wk 0.96 0.84–1.10 0.556 1.66 0.93–2.96 0.085 0.68 0.32–1.46 0.325 0.83 0.39–1.79 0.639 0.99 0.64–1.54 0.961 1.74 1.25–2.43 0.001* 1.11 0.72–1.71 0.651 0.72 0.45–1.15 0.168 0.82 0.67–1.00 0.050*
Perceived impact in 1 year
No change 1.09 0.90–1.33 0.375 0.70 0.30–1.65 0.417 1.00 0.35–2.92 0.994 1.16 0.39–3.42 0.792 0.97 0.51–1.84 0.936 1.53 0.90–2.59 0.118 1.44 0.75–2.78 0.278 2.67 1.43–5.00 0.002* 0.96 0.72–1.27 0.771
Heighted awareness of hygiene 0.88 0.76–1.03 0.264 1.22 0.64–2.30 0.467 1.66 0.71–3.86 0.831 1.63 0.69–3.85 0.938 1.06 0.65–1.75 0.924 0.76 0.52–1.12 0.149 0.65 0.40–1.05 0.174 0.44 0.27–0.72 0.001* 0.96 0.77–1.19 0.712
Increase use of PPE 0.92 0.79–1.07 0.486 0.97 0.52–1.81 0.880 0.85 0.37–1.95 0.697 1.24 0.53–2.88 0.670 1.07 0.66–1.75 0.694 0.68 0.47–0.98 0.099 0.50 0.31–0.80 0.011* 0.62 0.38–1.01 0.110 1.22 0.98–1.52 0.083
Ask patients to reschedule if sick 1.13 0.97–1.32 0.066 0.99 0.52–1.87 0.950 0.84 0.37–1.94 0.816 0.99 0.42–2.30 0.950 1.32 0.81–2.15 0.198 0.99 0.67–1.44 0.929 1.00 0.62–1.62 0.923 1.10 0.67–1.81 0.724 1.08 0.87–1.34 0.624
Increase nonoperative measures prior to surgery 1.00 0.83–1.21 0.879 1.43 0.69–2.98 0.306 0.68 0.26–1.80 0.562 0.94 0.35–2.52 0.964 1.24 0.69–2.23 0.451 0.85 0.54–1.33 0.533 0.55 0.30–1.04 0.072 0.88 0.48–1.59 0.643 1.38 1.07–1.78 0.017
Increase digital options for communication 1.08 0.93–1.26 0.329 1.34 0.72–2.48 0.359 1.15 0.49–2.65 0.751 1.45 0.62–3.39 0.397 1.16 0.71–1.89 0.547 1.08 0.75–1.56 0.687 0.65 0.40–1.06 0.082 0.81 0.49–1.33 0.398 0.88 0.71–1.10 0.275
Other Perceptions
Media perceptions 1.01 0.88–1.16 0.868 0.60 0.34–1.06 0.078 0.58 0.28–1.20 0.142 0.76 0.36–1.60 0.470 1.30 0.84–2.01 0.242 1.16 0.84–1.62 0.369 1.27 0.83–1.93 0.273 1.17 0.75–1.82 0.497 1.12 0.92–1.37 0.247
Perception of hospital effectiveness 1.49 1.28–1.74 < 0.001* 0.62 0.34–1.12 0.115 1.60 0.68–3.77 0.283 1.27 0.53–3.04 0.592 1.26 0.77–2.06 0.362 1.99 1.39–2.85 < 0.001* 1.95 1.22–3.11 0.005* 0.98 0.61–1.57 0.939 0.74 0.60–0.91 0.005*
Perception of government effectiveness 1.14 0.99–1.32 0.073 0.62 0.35–1.10 0.105 0.89 0.42–1.92 0.770 0.84 0.39–1.82 0.653 1.19 0.75–1.90 0.467 1.15 0.81–1.63 0.449 1.13 0.71–1.78 0.608 0.87 0.55–1.39 0.572 0.93 0.76–1.14 0.483
Warning patients if the surgeon is COVID-19 positive 1.40 1.18–1.67 < 0.001* 0.87 0.45–1.67 0.676 1.33 0.52–3.40 0.549 1.83 0.70–4.79 0.220 1.20 0.71–2.01 0.503 0.57 0.38–0.88 0.010* 0.93 0.52–1.64 0.792 0.57 0.33–0.99 0.047* 0.74 0.58–0.93 0.010*

All multivariate models were assessed using the same set of independent factors and included baseline demographics, practice, specific variables, and number of medical comorbidities.

Multivariate logistic regression was used to assess survey responses with simple binary outcomes where ordinal logistic regression was implemented for questions with ordinal scales.

COVID-19, coronavirus disease 2019; OR, odds ratio; CI, confidence interval; PPE, personal protective equipment.

* p < 0.05, statistical significance.

REFERENCES

1. Mauffrey C, Trompeter A. Lead the way or leave the way: leading a Department of Orthopedics through the COVID-19 pandemic. Eur J Orthop Surg Traumatol 2020 30:555-7.
crossref pmid pmc pdf
2. Lancaster EM, Sosa JA, Sammann A, et al. Rapid response of an academic surgical Department to the COVID-19 pandemic: implications for patients, surgeons, and the community. J Am Coll Surg 2020 230:1064-73.
crossref pmid pmc
3. Louie PK, Harada GK, McCarthy MH, et al. The Impact of COVID-19 Pandemic on Spine Surgeons Worldwide. Global Spine J 2020 219256822092578.
crossref
4. Wax RS, Christian MD. Practical recommendations for critical care and anesthesiology teams caring for novel coronavirus (2019-nCoV) patients. Can J Anaesth 2020 67:568-76.
crossref pmid pmc pdf
5. Soh TLT, Ho SWL, Yap WMQ, et al. Spine surgery and COVID-19. Challenges and strategies from the front lines. J Bone Joint Sur 2020 Apr 15 https://doi.org/10.2106/JBJS.20.00503.
crossref
6. Spagnolo P, Balestro E, Aliberti S, et al. Pulmonary fibrosis secondary to COVID-19: a call to arms? Lancet Respir Med 2020 S2213-2600(20):30222. -8. https://doi.org/10.1016/S2213-2600(20)30222-8. [Epub].
crossref
7. Guan WJ, Liang WH, Zhao Y, et al. Comorbidity and its impact on 1590 patients with COVID-19 in China: a nationwide analysis. Eur Respir J 2020 55:2000547.
crossref pmid pmc
8. Green A, Duthie HL, Young HL, et al. Stress in surgeons. Br J Surg 1990 77:1154-8.
crossref pmid
9. Shanafelt TD, Oreskovich MR, Dyrbye LN, et al. Avoiding burnout: the personal health habits and wellness practices of US surgeons. Ann Surg 2012 255:625-33.
crossref pmid
10. Dimou FM, Eckelbarger D, Riall TS. Surgeon burnout: a systematic review. J Am Coll Surg 2016 222:1230-9.
crossref pmid pmc
11. Lee DJ, Fleming LE, Gómez-Marín O, et al. Morbidity ranking of U.S. workers employed in 206 occupations: the National Health Interview Survey (NHIS) 1986-1994. J Occup Environ Med 2006 48:117-34.
crossref pmid
12. Bhupathiraju SN, Hu FB. Epidemiology of obesity and diabetes and their cardiovascular complications. Circ Res 2016 118:1723-35.
crossref pmid pmc
13. Blundell JE, Baker JL, Boyland E, et al. Variations in the prevalence of obesity among European countries, and a consideration of possible causes. Obes Facts 2017 10:25-37.
crossref pmid pmc
14. Wang B, Li R, Lu Z, et al. Does comorbidity increase the risk of patients with COVID-19: evidence from meta-analysis. Aging (Albany NY) 2020 12:6049-57.
crossref pmid pmc
15. Laniado-Laborín R. Smoking and chronic obstructive pulmonary disease (COPD). Parallel epidemics of the 21 century. Int J Environ Res Public Health 2009 6:209-24.
crossref pmid pmc
16. Alqahtani JS, Oyelade T, Aldhahir AM, et al. Prevalence, severity and mortality associated with COPD and Smoking in patients with COVID-19: a rapid systematic review and meta-analysis. PLoS One 2020 15:e0233147.
crossref pmid pmc
17. Gross CP, Mead LA, Ford DE, et al. Physician, heal Thyself? Regular source of care and use of preventive health services among physicians. Arch Intern Med 2000 160:3209-14.
crossref pmid
18. Taub S, Morin K, Goldrich MS, et al. Physician health and wellness. Occup Med (Lond) 2006 56:77-82.
crossref pmid pdf
19. Gupta HO, Gupta S, Carter RL, et al. Does orthopaedic surgical training induce hypertension? A pilot study. Clin Orthop Relat Res 2012 470:3253-60.
crossref pmid pmc
20. Sharma MS, Thapa A, Chandra SP, et al. Intraoperative pulse and blood pressure recordings of neurosurgeons: a pilot study of cardiovascular performance. Neurosurgery 2010 66:893-9.
crossref pmid pdf
21. Kruse CS, Krowski N, Rodriguez B, et al. Telehealth and patient satisfaction: a systematic review and narrative analysis. BMJ Open 2017 7:e016242.
crossref pmid pmc
22. Movassaghi K, Basques BA, Louie PK, et al. The duration of symptoms does not impact clinical outcomes following lumbar decompression surgery. Spine (Phila Pa 1976) 2019 44:305-8.
crossref pmid
23. The sick physician. Impairment by psychiatric disorders, including alcoholism and drug dependence. JAMA 1973 223:684-7.
crossref pmid
24. Weinger MB, Ancoli-Israel S. Sleep deprivation and clinical performance. JAMA 2002 287:955-7.
crossref pmid
25. Defoe DM, Power ML, Holzman GB, et al. Long hours and little sleep: work schedules of residents in obstetrics and gynecology. Obstet Gynecol 2001 97:1015-8.
crossref pmid
26. Firth-Cozens J, Greenhalgh J. Doctors’ perceptions of the links between stress and lowered clinical care. Soc Sci Med 1997 44:1017-22.
crossref pmid
27. Shanafelt TD, Bradley KA, Wipf JE, et al. Burnout and selfreported patient care in an Internal medicine residency program. Ann Intern Med 2002 136:358-67.
crossref pmid


Editorial Office
CHA University, CHA School of Medicine Bundang Medical Center
59 Yatap-ro, Bundang-gu, Seongnam-si, Gyeonggi-do 13496, Korea
Tel: +82-31-780-1924  Fax: +82-31-780-5269  E-mail: support@e-neurospine.org
The Korean Spinal Neurosurgery Society
#407, Dong-A Villate 2nd Town, 350 Seocho-daero, Seocho-gu, Seoul 06631, Korea
Tel: +82-2-585-5455  Fax: +82-2-2-523-6812  E-mail: ksns1987@gmail.com
Business License No.: 209-82-62443

Copyright © The Korean Spinal Neurosurgery Society.

Developed in M2PI

Close layer
prev next