


INTRODUCTION
With the aging of the population, osteoporosis has emerged as a global health concern among the elderly. Approximately 30% of elderly individuals worldwide suffer from osteoporosis, with postmenopausal women being the predominant demographic affected [1,2]. Fragility fractures primarily attributed to osteoporosis represent the most common cause of such fractures [3]. These fractures occur without significant traumatic force or low-energy trauma and most frequently affect the spine and hip joints [4]. Among the fragility fractures, vertebral fragility fractures constitute approximately 50% of all the fracture types and can result in pain, spinal deformity, paralysis, and even mortality [5,6].
Various methods are currently available for assessing the thoracolumbar bone quality, including dual-energy x-ray absorptiometry (DEXA), computed tomography (CT), magnetic resonance imaging (MRI), and quantitative CT. DEXA is the current gold standard for evaluating the lumbar vertebral quality [7]. However, in patients with degenerative spinal conditions, the bone mineral density (BMD) and the T score measured via DEXA may be elevated due to factors such as spinal scoliosis, degenerative joint disease, osteophyte formation, and sclerosis [8-11]. Consequently, selecting an appropriate and sensitive method for identifying individuals at high risk of thoracolumbar fragility fractures becomes particularly crucial.
Many studies have recommended the use of vertebral Hounsfield units (HU) measured from CT images as a supplementary method for assessing bone density and have confirmed a positive correlation between the vertebral HU and BMD [12]. The advantage of CT-measured HU lies in its ability to bypass degenerated areas, focusing on trabecular bone, which is highly susceptible to osteoporosis [13]. A novel technique for assessing vertebral quality, known as vertebral bone quality (VBQ), recently emerged. The VBQ is measured using non-contrast T1-weighted lumbar spine MRI, which calculates the vertebral signal intensity (SI) to cerebrospinal fluid (CSF) ratio. This method not only has advantages similar to HU values but also eliminates radiation exposure. Research has shown that VBQ serves as a valuable adjunctive tool in diagnosing osteoporosis [14].
However, a few studies have simultaneously delved into the prediction of thoracolumbar fragility fractures based on HU, VBQ, and BMD values. Furthermore, research on the thresholds for predicting thoracolumbar fragility fractures using HU and VBQ remains sparse. This study marks the effort to concurrently investigate which parameter among lumbar vertebral HU, VBQ, and the BMD is most effective in predicting the risk of thoracolumbar fragility fractures and establish thresholds for predicting such fractures.
MATERIALS AND METHODS
1. Patient Selection
Patients who visited The First Affiliated Hospital of Anhui Medical University Department of Spinal Surgery between January 2019 and June 2023 for acute thoracolumbar fragility fractures without apparent external or low-energy trauma were included in the study. Ethical approvals were provided by the ethics committee of the First Affiliated Hospital of Anhui Medical University Ethics Committee (ethics approval number: PJ2023-12-59). Since this is a retrospective study, formal consent is not required. Two senior spinal surgeons independently identified acute thoracolumbar vertebral fractures using spinal MRI. In cases with a discrepancy in the assessment results between the 2 senior surgeons, a third senior spinal surgeon made the final determination. Importantly, none of the 3 surgeons had access to the patients’ personal information.
Patients who met the following criteria were included in the study: (1) Patients aged 55 years and older. (2) Patients who experienced acute thoracolumbar vertebral fractures due to low-energy trauma or without apparent external trauma. (3) Patients who underwent lumbar spine CT, DEXA, and MRI examinations within one week after the occurrence of the fracture. Patients who met any of the following criteria were excluded from the study: (1) Patients with a history of significant traumatic injuries, such as injuries from car accidents, falls from heights, or other violent traumas, and those with a history of spinal surgery. (2) Patients with systemic or spinal tumors, spinal infections, intervertebral disc inflammation, or long-term metabolic or wasting diseases, like hyperthyroidism or hypothyroidism. (3) Patients with unclear or inadequate imaging data.
This is a matched cohort study. A total of 78 patients diagnosed with thoracolumbar fragility fractures were included in this retrospective research. Meanwhile, 78 patients with degenerative spinal diseases were selected and matched as the control groups in terms of age, gender, and body mass index (BMI) from the medial records. Additionally, demographic information, such as smoking history, diabetes, hypertension, and coronary artery disease were recorded for all patients.
2. Measurement of VBQ
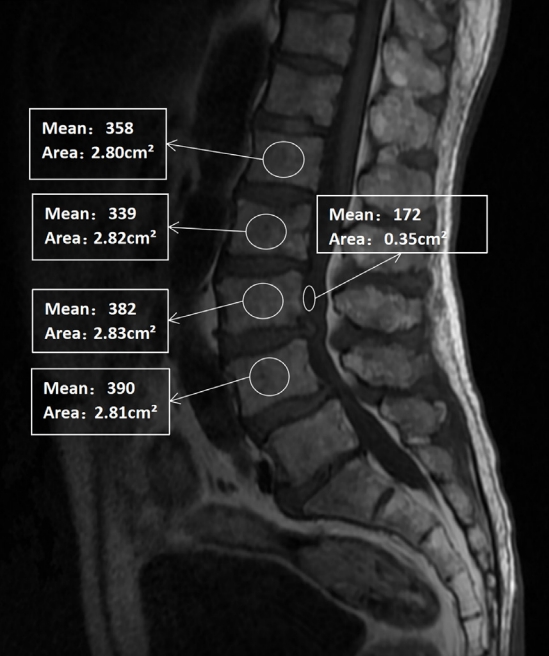
The patients underwent examinations using a MRI machine, conducted at 1.5 Tesla. All images were transferred to a computer in DICOM format and evaluated and analyzed using the Picture Archiving and Communication System (PACS) software. Two experienced radiologists, who were blinded to patient information, separately measured the VBQ of the patients on non-enhanced MRI T1-weighted images using the PACS software. Regions of interest (ROI) were positioned within the marrow of the L1–4 vertebrae and in the CSF space at the L3 level to measure the VBQ. To minimize measurement errors, efforts were made to maintain consistent ROI sizes for each vertebra. The average SI within each ROI was recorded [15]. Subsequently, the average signal values of the vertebral bodies in the sagittal plane of L1–4 were determined. These values were then divided by the signal value of the CSF at the L3 level. This calculation yielded the VBQ (Fig. 1) [16]. When abnormalities existed in the vertebrae, such as fractures or severe degeneration, the segment in question was excluded from the study. In cases where of complete blockage of the CSF signal at the L3 level, the signal value from the adjacent segment was used instead [17]. The average VBQ for L1–4 was calculated by taking the mean of the VBQ results obtained for the vertebrae within the L1–4 range. To calculate the VBQ for an individual vertebra, the SI of that specific vertebra was divided by the CSF signal value at the L3 level, producing the VBQ for that single vertebral segment [18].
3. Measurements of Vertebral HU
CT images of the patient’s lumbar spine in DICOM format were obtained through the PACS software. Two experienced radiologists, who were blinded to patient information, separately measured the vertebral HU of the patients using the PACS software. Vertebral bodies were located in the mid-sagittal images of the lumbar vertebral marrow, and elliptical ROI were placed at the midpoint of the selected vertebral body’s cross-section. The average signal value was then recorded [19,20]. The principle for placing the ROI was to include as much trabecular bone as possible while avoiding cortical bone and heterogeneous areas, such as the posterior venous plexus and bone islands [21]. HU measurements were taken separately for the cross-sectional images of the L1, L2, L3, and L4 vertebral bodies. These measurements were recorded as individual vertebral HU values. The patient’s lumbar spine L1–4 HU average value was obtained by taking the mean of these results. Segments with vertebral abnormalities, such as fractures or severe degeneration, were excluded from the study. In such cases, the average HU value from the remaining vertebral bodies within the L1–4 range was included in the study (Fig. 2). The final record included the HU values obtained from both measurements.
4. BMD and T Score of the Lumbar Spine Were Measured Using DEXA
The BMD and T-score information for L1, L2, L3, and L4 obtained through DEXA was exported by our hospital’s bone density facility. Using the patient’s lumbar spine MRI and CT scans, abnormal vertebral bodies, such as fractures or severe degeneration, were identified. These segments were excluded from the study, and the BMD and T-score information for the remaining vertebral bodies within the L1–4 range was included in the research.
5. Statistical Analysis
Statistical analysis was conducted using IBM SPSS Statistics ver. 27.0 (IBM Co., Armonk, NY, USA). Descriptive statistics were obtained using the means and the standard deviations. For normally distributed continuous variables, an independent sample t-test was performed. The nonnormally distributed continuous variables were analyzed using the Mann-Whitney U-test and the independent t-test. Categorical variables were compared using the chi-square test. The Pearson or Spearman correlation coefficients was used to calculate the correlations between HU, VBQ, BMD and the number of thoracolumbar fragility fractures. The area under curve (AUC) and thresholds for HU and VBQ in predicting osteoporosis were calculated for both groups. Receiver-operator curve was utilized to evaluate the efficacy of lumbar HU and VBQ in predicting osteoporosis and the efficacy of lumbar HU, VBQ, and BMD in predicting thoracolumbar fragility fractures.
RESULTS
1. Demographic Characteristics of the Patients
In the fracture group, the gender distribution was 21 males and 57 females, with an average age of 68.0±7.2 years and a mean BMI of 23.6± 3.5 kg/m2. The control group had 16 males and 62 females, with an average age of 67.0± 6.6 years and an average BMI of 24.5± 3.1 kg/m2. No statistically significant differences existed between the 2 groups in terms of gender, age, BMI, smoking status, diabetes, hypertension, or coronary heart disease (p > 0.05) (Table 1).
2. Correlation Among HU, VBQ, and BMD Values
The mean HU, VBQ, and BMD in the cohort of 156 patients were 86.43± 36.07, 3.38± 0.63, and 0.88± 0.18, respectively. Significant correlations were evident among the individual vertebral bodies and the averaged HU, VBQ, and BMD values within the L1–4 regions. Specifically, HU exhibited positive correlations with BMD (p < 0.001), while VBQ demonstrated negative correlations with HU, and BMD (p < 0.05) (Table 2).
3. Characteristics Comparisons Between Fracture and Control Groups on HU, VBQ, and BMD values
In the fracture group, the individual vertebral bodies and the average HU, and BMD for L1–4 were significantly lower than those in the control group (p < 0.01). Conversely, in the fracture group, the individual vertebral bodies and the average VBQ for L1–4 were higher than those in the control group. Significant differences in VBQ were observed at L2 and L4, and the average VBQ for L1–4 (p < 0.05). The disparities observed at L1 (p = 0.077) and L3 (p = 0.218) between the 2 groups did not reach statistical significance (Table 3).
4. Correlations Between the Number of Thoracolumbar Fragility Fractures and Indicators, Including HU, VBQ, and BMD Values
In the fracture group of 78 patients, 91 thoracolumbar vertebral body fractures were recorded. Among them, 67 individuals had fractures in one segment, 9 individuals had fractures in 2 segments, and 2 individuals had fractures in 3 segments of the thoracolumbar spine. The findings show an inverse relationship between the average HU, BMD for L1–4 and number of fractures (p < 0.001). The average VBQ for L1–4 was positively correlated with the number of fractures (p = 0.045). Low HU, BMD, and high VBQ were associated with the occurrence of multisegment thoracolumbar fragility fractures (Table 4).
5. HU and VBQ as Predictors of Osteoporosis
Among the 156 patients included in this study, 76 were diagnosed with osteoporosis (T score ≤ -2.5). HU and VBQ are effective in predicting osteoporosis, The respective thresholds for HU and VBQ are 87.50 and 3.30. The efficacy of the L1–4 average HU (AUC =0.848, p < 0.001) in predicting osteoporosis surpasses that of the L1–4 average VBQ (AUC = 0.641, p = 0.002) (Table 5).
6. Prediction of Thoracolumbar Fragility Fractures Based on HU, VBQ, and BMD Values
1) Prediction of thoracolumbar fragility fractures using CT-measured HU
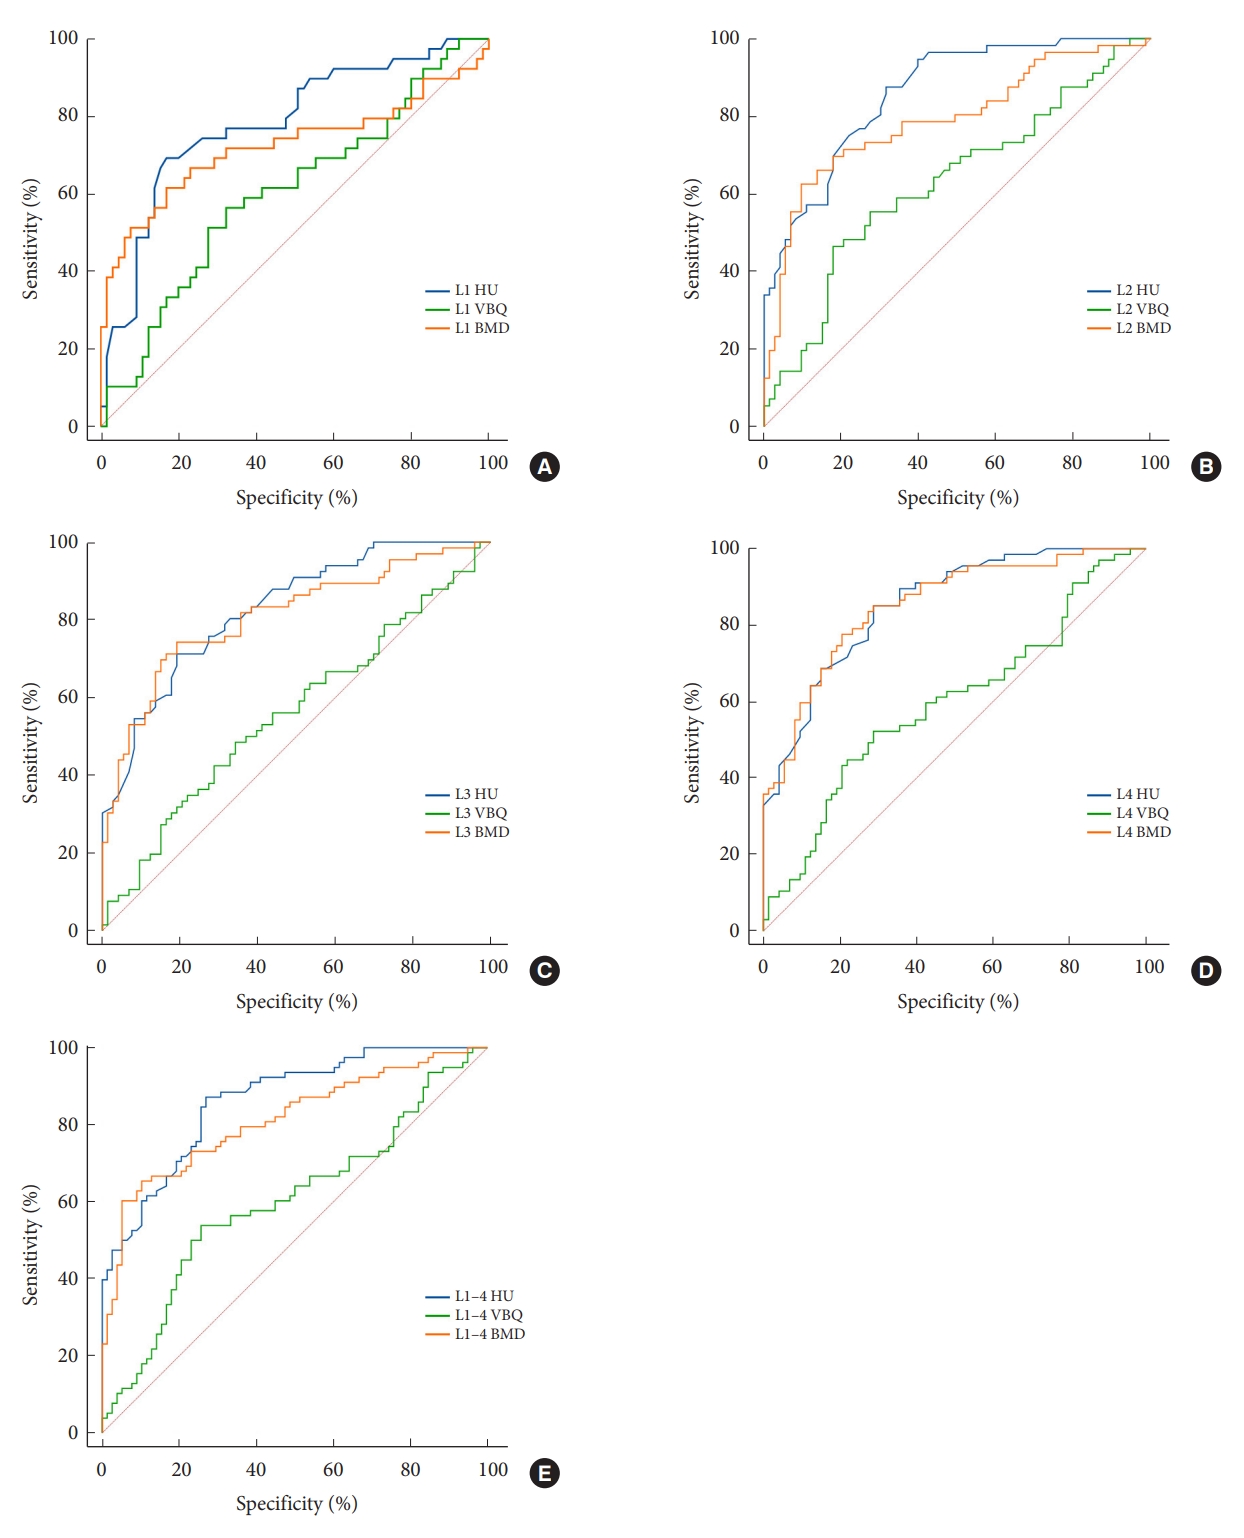
The predictive efficacy of the L1–4 average HU for thoracolumbar fragility fractures (AUC = 0.863, p < 0.001) with the threshold of 88 surpasses that of any individual vertebral HU measurement. Among the individual vertebral HU measurements for predicting thoracolumbar fragility fractures, the highest predictive efficacy is observed for L2 (AUC =0.861, p < 0.001), followed by L4 (AUC = 0.855, p < 0.001), L3 (AUC = 0.827, p < 0.001), and L1 (AUC = 0.783, p < 0.001), with corresponding thresholds of 92, 86, 70, and 88, respectively (Table 6; Fig. 3A–E).
2) Prediction of thoracolumbar fragility fractures based on VBQ measured through MRI
The prediction efficacy of thoracolumbar fragility fractures using the average VBQ of L1–4 is AUC = 0.602 (p = 0.027), with a corresponding threshold of 3.37. Among the individual vertebral bodies, the highest predictive efficacy for thoracolumbar fragility fractures is observed for L2 VBQ (AUC =0.630, p=0.010), with a threshold of 3.59. L4 VBQ (AUC = 0.597, p = 0.045) also shows a significant predictive power, with a threshold of 3.38. The statistical results for L1 (AUC = 0.604, p = 0.075) and L3 (AUC = 0.561, p = 0.219) do not exhibit significant predictive ability for thoracolumbar fragility fractures (Table 6; Fig. 3A–E).
3) Predicting thoracolumbar fragility fractures using BMD measurements obtained through DEXA scans
The L1–4 average BMD measurements have a promising predictive efficacy with a threshold of 0.81 (AUC =0.813, p < 0.001). Among these measurements, the L4 BMD demonstrates the highest predictive efficacy (AUC = 0.853, p < 0.001) with a threshold of 0.93. The next vertebral level with a notable predictive efficacy is the L3 BMD (AUC = 0.810, p < 0.001) with a threshold of 0.87. For L2 BMD (AUC = 0.790, p < 0.001) demonstrated predictive efficacy with a threshold of 0.73. Lastly, the L1 BMD (AUC = 0.725, p < 0.001) exhibited predictive efficacy with a threshold of 0.76 (Table 6; Fig. 3A–E).
4) Comparative efficacy of HU, VBQ, and BMD measured by DEXA in predicting thoracolumbar vertebral fragility fractures
Among the 3 indicators of the L1–4 average HU, VBQ, and BMD, HU demonstrates the highest predictive efficacy for thoracolumbar vertebral fragility fractures. Next, the DEXA-measured BMD exhibits a relatively high predictive efficacy, while VBQ is the least effective among these 3 indicators (Table 6; Fig. 3E).
DISCUSSION
1. The Current Application of Lumbar CT, MRI, and DEXA in Vertebral Quality Assessment
DEXA is widely acknowledged as the gold standard for diagnosing osteoporosis. Most middle-aged and elderly individuals undergo osteoporosis screening, primarily utilizing DEXA [7,22,23]. However, trabecular bone, which is particularly susceptible to osteoporosis, can be more accurately evaluated using the HU measured through CT than DEXA. The advantage lies in the selective measurement of the trabecular bone while bypassing the cortical bone [13]. Lumbar or thoracoabdominal CT scans are extensively employed for assessing bone quality and opportunistic screening for osteoporosis. Previous studies by Pickhardt, Carberry, and others have substantiated a notable correlation between the HU values measured via lumbar or thoracoabdominal CT scans and the BMD and T scores obtained from DEXA [19,24,25]. However, when detecting changes in the vertebral bone microstructure, bone contusions, or minor compression fractures, x-rays and CT scans often prove inadequate [26]. In recent years, some scholars have advocated for the utilization of MRI in the assessment of lumbar VBQ. MRI’s sensitivity to signal changes related to alterations in bone microstructure, such as trabecular bone fat infiltration and subtle vertebral microdamage [27], has gradually made it a routine examination for vertebral fractures, particularly in the thoracolumbar fractures of the elderly [28]. The advantage of measuring lumbar vertebral HU and VBQ through CT and MRI lies in their ability to selectively assess trabecular bone, bypassing the cortical bone [13,16]. HU, VBQ, and the BMD obtained from DEXA scans all serve as indicators reflecting the vertebral quality. However, no relevant research is currently available to determine which of these indicators exhibits the highest predictive efficacy for thoracolumbar vertebral fragility fractures.
We conducted predictive and correlational studies simultaneously encompassing the HU, VBQ, and BMD obtained through CT, MRI, and DEXA scans for the prediction of thoracolumbar fragility fractures. Prior to this, most studies included only one of the parameters: HU, VBQ, BMD, or T score [18,21,29]. Additionally, we established a nonfracture control group that matches the fracture group in gender, age, and BMI to assess the predictive efficacy of HU, VBQ, and BMD in the context of thoracolumbar fragility fractures. Furthermore, we ensured consistency in the measurement segments for all patients’ lumbar assessments by removing fractured and severely degenerated vertebral bodies within the L1–4 range and subsequently measuring the average HU, VBQ, and BMD for each individual vertebral body and L1–4. This approach sets our study apart from previous research endeavors.
2. HU, VBQ, and BMD Can All Indicate the Bone Quality of the Lumbar Spine
Our research findings indicate a strong positive correlation between HU and the DEXA-measured BMD, which is consistent with the results of Alacreu et al. [30] Huang et al. [31] discovered an inverse relationship between VBQ, HU, which is also significantly correlated and consistent with our study’s results.
The mean HU, VBQ, and BMD exhibited significant differences between the fracture and control groups. The HU of the fracture group is substantially lower than that of the control group, as measured by DEXA for the BMD, whereas the VBQ was higher than that in the control group. This result suggests a noticeable difference in vertebral quality between the fracture and control groups, with the patients in the fracture group displaying inferior bone quality. Furthermore, HU, BMD displayed a significant negative correlation with the number of thoracolumbar fragility fractures, while VBQ exhibited a positive correlation with the number of thoracolumbar fragility fractures. This finding implies that low HU, BMD and high VBQ are significantly associated with multisegment thoracolumbar fragility fractures, which is consistent with the research results of Zou et al. [21], who found a correlation between low HU values and a high number of vertebral fragility fractures. Given the strong correlation among the 3 indicators, all of which can reflect the quality of vertebral bone, and the significant differences between the fracture and control groups, how effective are they in diagnosing osteoporosis and thoracolumbar fragility fractures? Previous researches have rarely focused on the above-mentioned questions, which are what we have explored in this study.
3. HU and BMD Are Used to Predict Osteoporosis and Thoracolumbar Fragility Fractures
In this study, we also assessed the predictive capability of L1–4 HU for osteoporosis. HU exhibited a strong predictive efficacy for osteoporosis, with a threshold of 87.5. This value is near the threshold of 86 reported by Kim et al. [32]. Additionally, we determined the thresholds of 88 for L1–4 HU in predicting thoracolumbar fragility fractures. Notably, the similarity between the HU predicted osteoporosis threshold and the predicted thoracolumbar fragility fracture threshold suggests that patients with osteoporosis are at a significant risk of experiencing thoracolumbar fragility fractures. This finding aligns with the research conducted by LeBoff et al. [33], who established that osteoporosis is a crucial risk factor for vertebral fragility fractures. This finding further substantiates the reasonableness of the HU threshold we derived for predicting osteoporosis. Zou et al. [21] previously studied the use of L1 HU as a predictor for thoracolumbar fragility fractures and recorded the threshold of 66. Our research results suggest that L1 HU or L1–4 HU has a threshold of 88 for predicting thoracolumbar fragility fractures. We attribute this difference to potential variations in sample age; the study of Zou et al. included patients who were ≥ 65 years, while our study included patients who were ≥ 55 years. Although the DEXA-derived BMD can be influenced by factors such as compression fractures, osteophyte formation, and osteosclerosis [8-11], they still exhibit a relatively high predictive efficacy for thoracolumbar fragility fractures, although not as high as HU. This can also explain our previous observation of a strong positive correlation between BMD and HU.
4. VBQ Is Used to Predict Osteoporosis and Thoracolumbar Fragility Fractures
VBQ exhibited moderate efficacy in predicting osteoporosis, which is consistent with the results obtained by Özmen et al. [34], Yin et al. [35], and others. In prior research, Ehresman et al. [36] found that VBQ is an independent predictor of thoracolumbar fragility fractures. Li et al. [18] identified the threshold of 3.48 for predicting thoracolumbar fragility fractures using VBQ, and the threshold of 3.60 for single-level VBQ. Age, sex, and BMI significantly impact bone quality, yet previous studies did not control for these factors [18,37]. Therefore, we established a control group matched in age, sex, and BMI without fractures. Our study revealed the threshold of 3.37 for predicting thoracolumbar fragility fractures using L1–4 VBQ. This predicted threshold is lower than that reported by Li et al. [18] (3.48). We speculate that Li et al. might not have adequately accounted for the impact of age and BMI on bone quality in their analysis.
5. Comparing the Efficacy of Individual Vertebral HU, VBQ, and BMD in Predicting Thoracolumbar Fragility Fractures
HU, VBQ, and the DEXA-measured BMD can all predict thoracolumbar fragility fractures. Upon admission, patients who undergo lumbar spine CT and DEXA examinations can be screened for a high-risk population for thoracolumbar fragility fractures on the basis of the measurement results of both tests. Our study concludes that when a patient’s lumbar spine L1–4 HU ≤ 88, L1–4 BMD ≤ 0.81, they should be categorized as individuals at high risk of thoracolumbar fragility fractures. Timely preventive measures should be taken, as similarly reported by Lee, Kyung, MS Le Boff, and others [32,33,38]. Our research suggests that when a patient’s L1–4 VBQ is ≥ 3.37, they may be at a high risk of developing thoracolumbar fragility fractures. Although VBQ exhibits a significant correlation with HU and BMD, its efficacy in predicting thoracolumbar fragility fractures is moderate. VBQ is not as reliable as HU and BMD and should be considered as a supplementary tool for predicting thoracolumbar fragility fractures. In this study, we compared the predictive efficacy of HU, VBQ, and BMD for individual vertebral bodies in predicting thoracolumbar fragility fractures. Although certain individual vertebral indicators exhibited higher predictive efficacy than the L1–4 averages, such as VBQ in predicting thoracolumbar fragility fractures (with L2 > L1–4 > L4), and BMD in predicting thoracolumbar fragility fractures (with L4 > L1–4 > L3 > L2 > L1), we recommend using the L1–4 average to predict thoracolumbar fragility fractures. This recommendation is based on the possibility of occasional anomalies in individual vertebral bodies, such as old fractures or severe degeneration. Assessing the spinal fracture risk on the basis of individual vertebral bodies may introduce errors due to the occasional nature of these anomalies. In contrast, using the L1–4 average instead of individual vertebral bodies provides a representative reflection of the overall lumbar spine bone quality. Even if an individual vertebral body within the L1–4 range has an old fracture or severe degeneration that cannot be measured, the average of the adjacent vertebral bodies can still be used as the measurement value.
6. Why do HU, VBQ, and BMD Have Different Predictive Efficacies for Thoracolumbar Fragility Fractures?
Our research findings indicate that HU, VBQ, and BMD can all serve as predictors for thoracolumbar fragility fractures. Among these parameters, lumbar spine HU exhibits the most robust predictive performance, while BMD demonstrate relatively good predictive capabilities, and VBQ shows moderate predictive efficacy. The measurements for the 3 indicators, HU, VBQ, and BMD, all originate from the same patient’s vertebrae. However, their predictive efficacy for thoracolumbar fragility fractures varies. This might be related to the working principles and characteristics of their respective machines.
During the CT imaging procedure, as x-ray photons traverse the patient’s anatomy, they undergo differential attenuation based on the inherent radiological properties of the encountered tissues and structures. For instance, osseous structures exhibit a higher attenuation coefficient than soft tissues due to their calcium composition, rendering them more radiopaque on CT images. The gantry, which houses the x-ray tube and detectors, rotates circumferentially around the patient, capturing tomographic projections of the lumbar region from myriad perspectives. Each voxel within a CT slice encapsulates a specific attenuation value, quantified in HU, derived from the linear attenuation coefficient of the tissue. Notably, distinct anatomical substrates like bone, air, and soft tissue manifest characteristic HU ranges, this allows for the acquisition of higher-resolution slices, which facilitate the observation of subtle changes in the bone structure. Advanced post-processing algorithms enable the generation of axial, coronal, and sagittal slices from the acquired data [39]. By collating these slices, volumetric 3-dimensional reconstructions can be synthesized, offering an intricate and holistic evaluation of the lumbar anatomy [40]. Since trabecular bone is most affected by osteoporosis rather than cortical bone, lumbar spine images obtained from CT allow for the selective direct measurement of the HU values of the trabecular bone [13]. This approach can avoid the influence of cortical bone and osteophyte formation, providing a more accurate reflection of vertebral quality.
VBQ involves measuring the average signal value of L1–4 vertebral bodies under T1-weighted imaging relative to the CSF in L3. This ratio primarily reflects the fatty signal within the vertebral trabecular bone, and an increase in fat cells within the vertebral trabecular bone as age advances can lead to a decrease in bone quality [41,42]. MRI-based VBQ measurements, whether for predicting osteoporosis or thoracolumbar fragility fractures, exhibit a generally lower level of predictive efficacy than HU and the BMD obtained through DEXA. This discrepancy may be attributed to the inherent working principles of MRI, which is primarily advantageous for soft tissue imaging within the body. SI on MR images are influenced by numerous factors, including MR hardware, tissue characteristics (such as T1 and T2 relaxation times, proton density, flow, and motion), pulse sequence types, k-space filling methods, reconstruction algorithms, and grayscale displays [27]. Adjusting these parameters is a complex process. In the trabecular bone, the bone marrow consists of yellow and red marrow and serves as vital hematopoietic and immune tissue. Fat tissue is also a significant component of bone marrow. Research has confirmed that both bone marrow adipocytes and osteoblasts originate from a common precursor—bone marrow mesenchymal stem cells. As age advances, osteoblasts decrease due to the increase in fat cells. The decline in trabecular bone quality is associated with the increase in fat cells within the vertebral trabecular bone [41,42]. In T1-weighted MR images of the lumbar spine, the signal values of trabecular bone decrease as fat infiltrates the bone [43]. Given that the signal value of CSF remains constant, dividing the average signal value of the lumbar vertebral trabecular bone by the signal value of CSF yields VBQ [14]. Therefore VBQ primarily reflects the bone quality indirectly through the MRI’s assessment of fat signals within the lumbar vertebral bodies. However, other factors can also influence the vertebral body fat content. Krug et al. found a correlation between early intervertebral disc degeneration and vertebral body fat content [44]. The inflammatory components released by intervertebral discs may also trigger an autoimmune response and accelerate adjacent vertebral body fat changes [45,46]. All of these factors could potentially affect the VBQ.
The BMD measured through DEXA provide a 2-dimensional area value at the scanning plane, representing an average that includes both cortical and trabecular bones. Therefore, their measurements may be subject to overestimation due to variations in bone size and the presence of surrounding bone hypertrophy [47,48]. Although in this study, the DEXA-derived BMD demonstrated a relatively high efficacy in predicting thoracolumbar fragility fractures, the potential influence of factors such as spinal degeneration, arterial calcification, osteophyte formation, and osteosclerosis on BMD must be acknowledged, as highlighted in previous research [19,25]. On the one hand, DEXA can impose additional financial burdens and radiation exposure on hospitalized patients [19], especially those with spinal fractures who face increased risks during transportation and positional changes for examinations [13,21]. On the other hand, most hospitalized surgical patients routinely undergo lumbar spine CT scans preoperatively, making HU measurements feasible using existing imaging data without incurring extra costs [13,21]. HU measurements offer convenience, reliability, and ease of implementation, rendering this approach highly accessible [49].
7. Limitations
This study has several limitations that should be acknowledged. First, the research only included patients scheduled for spinal surgery, and the imaging data from individuals without medical conditions were not analyzed. Second, the study primarily focused on thoracolumbar fragility fractures and may not be able to predict fragility fractures in other anatomical regions. Moreover, the study primarily involved individuals aged 55 and older, which may not fully represent the entire population, especially younger adults and those with early-onset osteoporosis. Additionally, the study was conducted in a specific geographic region or population, without considering potential regional or ethnic variations in bone health. Finally, this research is retrospective in nature and included a relatively small sample of 156 patients. In future studies with a larger prospective, randomized control samples are warranted to validate these findings.
CONCLUSION
Evidently, HU exhibited positive correlations with BMD while VBQ demonstrated negative correlations with HU and BMD. All of these measures can predict the risk of thoracolumbar fragility fractures. Among these parameters, HU exhibits the highest predictive efficacy, while the DEXA measurement of BMD offers a considerable level of predictability. VBQ derived from MRI has moderate efficacy among the 3 indicators.
For patients with available lumbar or thoracoabdominal CT images, prioritizing HU measurements is recommended when predicting thoracolumbar fragility fractures. For nonhospitalized individuals without lumbar CT images, the more cost-effective DEXA method for assessing BMD is a viable choice. MRI-based VBQ can serve as an auxiliary tool for predicting thoracolumbar fragility fractures, complementing the predictive capabilities of HU and BMD.


")