


INTRODUCTION
Robust glial responses following spinal cord injury (SCI) include the activation of microglia and the recruitment of blood-derived macrophages and reactive astrogliosis [1,2]. The macrophages accumulating at the injury site in the spinal cord are derived primarily from 2 sources: resident microglia-derived macrophages and bone marrow-derived macrophages. It is generally accepted that the activation of macrophages (macrophage polarization) at the injury site can lead to 2 different phenotypes: either a proinflammatory M1 subtype or an anti-inflammatory M2 subtype [3,4]. Although M1 and M2 macrophages are present in the injured spinal cord, the injury milieu appears to favor the polarization of M1 cytotoxic macrophages [5]. Previous research has shown that M1 macrophages secrete proinflammatory cytokines (tumor necrosis factor [TNF]-╬▒, IL-1╬▒, IL-1╬▓, and IL-6), while M2 macrophages secrete anti-inflammatory cytokines (IL-10, IL-4, and transforming growth factor [TGF]-╬▓) [1,5,6]. A large body of evidence supports the fact that the proinflammatory cytokines produced by activated M1 microglia/macrophage can mediate reactive astrogliosis, neurotoxic A1 astrocytes, and the formation of permanent glial scars [7-9]. Although astrogliosis in acute SCI is a defense mechanism to minimize and repair the initial damage, the subsequent formation of glial scars creates a physical barrier that hinders axonal growth [1,10] and creates a biochemical barrier that secretes chondroitin sulfate proteoglycans (CSPGs), which inhibit axonal regeneration [10-12]. There is increasing evidence that confining the formation of neurotoxic A1 astrocytes and glial scars following SCI can create a favorable microenvironment that facilitates neuronal survival and axonal regeneration [8,13]. In our previous study, we found that a combination of bone marrow mesenchymal stem cells (MSCs) with Governor Vessel electroacupuncture (EA) treatment caused the downregulated production of glial fibrillary acidic protein (GFAP) and CSPGs and improved axonal regeneration and functional recovery in a rat model of transected SCI 8 weeks after intervention [14]. However, the precise mechanisms underlying the effects of combining EA and MSCs on inhibiting glial scar formation in SCI remain to be elucidated.
EA is a type of acupuncture therapy in which a needle inserted into an acupoint is attached to a trace pulse current to induce synthetic stimulation [15]. EA has been reported to have several therapeutic effects, including anti-inflammatory effects, increased secretion of neurotrophic factors, and improvement in neural function, especially after SCI [15-17]. There is mounting evidence suggesting that EA treatment can attenuate the expression levels of proinflammatory cytokines [16-18]. On this basis, we hypothesized that EA can suppress the inflammation and glial scar formation induced by SCI. Moreover, MSCs derived from bone marrow have been shown to be a promising candidate for the treatment of SCI [19,20]. Indeed, the transplantation of MSCs has been shown to promote anatomical and functional recovery in animal models of SCI [14,15,21,22]. In addition, MSC grafts may promote axonal regeneration and facilitate functional improvement by downregulating the acute inflammatory response, reducing cavity formation, and reducing astrogliosis after SCI [21,23,24]. Many studies have demonstrated that MSCs can promote the polarization of macrophages from a ŌĆ£classically-activatedŌĆØ M1 phenotype toward an ŌĆ£alternatively-activatedŌĆØ M2 phenotype to modify the inflammatory environment [24-27]. The transplantation of MSCs or MSC-derived exosomes has also been shown to increase the number of ą£2 microglia/macrophages after SCI [27,28], thus creating a proregenerative microenvironment. Our previous studies demonstrated that the combination of MSCs transplantation and EA treatment can increase the levels of endogenous neurotrophic factors (such as NT-3) and reduce inflammation to protect the injured spinal neurons [14,15,22]. In addition, some studies revealed that transplantation of biomaterials loaded with NT-3 could reduce the number of microglia/macrophages in the injured area of the spinal cord [29,30]. Therefore, we speculated in this study that combination therapy could synergically inhibit the inflammatory response by promoting the polarization of proinflammatory M1 microglia/macrophages into anti-inflammatory M2 phenotype cells, and further restrain the hyperplasia of reactive astrocytes, especially A1 astrocytes.
The formation of glial scars is highly dependent on the interactions between reactive astrocytes and reactive microglia/macrophages. When activated, microglia/macrophages release cytokines that trigger and maintain the activation of astrocytes [31]. The depletion of microglia also causes attenuated glial scar formation, suggesting the crucial role of microglia in the formation of glial scars [32]. Furthermore, it has been reported that the expression and activation of epidermal growth factor receptor (EGFR/ErbB1) are upregulated in astrocytes following CNS injury [33] and that the signal transducer and activator of transcription 3 (STAT3) plays a key role in reactive astrogliosis and glial scar formation [34]. Thus, in the present study, we investigated whether the transplantation of MSCs combined with EA (MSCs+EA) could reduce the proinflammatory M1 microglia/macrophages, known to convert astrocytes into a neurotoxic A1 reactive astrocytes subtype, to attenuate glial scar formation via the ErbB1-STAT3 signal pathway and facilitate axonal regeneration. Our results suggested that MSCs combined with EA treatment could promote the polarization of M2 microglia/macrophages to attenuate inflammation, neurotoxic A1 astrocytes, and excessive astrogliosis and glial scar formation by downregulating the ErbB1-STAT3 pathway, thus fostering a favorable microenvironment conducive for axonal regeneration after SCI.
MATERIALS AND METHODS
1. Animals
Adult female Sprague-Dawley rats (220ŌĆō250 g, supplied by the Experimental Animal Center of Sun Yat-sen University) were used in all experiments and housed in a facility with an ambient temperature of 24┬░C ┬▒ 2┬░C, a controlled photoperiod (12:12 light/dark cycle), and with free access to food and water. Before the start of any experimental manipulations, rats were allowed to acclimatize to the housing facility for at least 7 days. All animal experiments were approved by the Ethics Committee of Zhongshan School of Medicine on Laboratory Animal Care of Sun Yat-sen University (Approval reference: 2017-027) and were performed in accordance with the laboratory animal management procedures of Zhongshan School of Medicine on Laboratory Animal Care, Sun Yat-sen University, China.
2. Cell Culture
Bone marrow MSCs were isolated as previously described [14] from green fluorescent protein (GFP) transgenic Sprague-Dawley rats (Osaka University, Osaka, Japan). These animals express GFP ubiquitously in all tissues (for in vivo cell tracing). In brief, the MSCs were harvested from the tibias and femurs of 10-dayold rats and then cultured in low-glucose DulbeccoŌĆÖs modified EagleŌĆÖs medium (L-DMEM, Gibco/BRL, Carlsbad, CA, USA) supplemented with 10% fetal bovine serum (FBS, TBD Co., Tianjin, China), 100 units/mL of penicillin, and 100 units/mL of streptomycin in an incubator supplied with 5% CO2 at 37┬░C. The medium was replaced to remove nonadherent cells at 48 hours. When the primary MSCs adhered and reached 80% confluence, the cells were passaged using 0.25% trypsin/0.02% EDTA at a ratio of 1:2; MSCs derived from passages 5 were used for the transplantation experiments.
Primary astrocytes were prepared from the cerebral cortices and spinal cords of 1-day-old neonatal rats. Briefly, the cerebral hemispheres and spinal cords were dissected. Following removal of the adherent meninges, the cortical tissue and spinal cords were isolated, triturated, trypsinized, and passed through a mesh to isolate mixed glial cells. The cells were centrifuged, and the pellet was resuspended in DMEM/F12 medium containing 10% FBS and seeded in 75-cm2 flasks until the cells were confluent. Microglia and oligodendrocytes were then removed by horizontal shaking at 200 rpm for 18 hours. This process yielded a culture of pure astrocytes with > 95% purity.
3. SCI and Cell Grafting
Animals that underwent complete transection at the T10 segment of the spinal cord were divided into 5 groups (15 rats in each group): (1) a control group that only received spinal cord transection surgery without any further treatment; (2) a nonacupoint EA-treated (NA-EA) group that received a nonacupoint EA treatment following spinal cord transection; (3) an EA group that received EA treatment following spinal cord transection; (4) an MSCs group that received the transplantation of MSCs after spinal cord transection; and (5) an MSCs+EA group that received the transplantation of MSCs after spinal cord transection, followed by EA treatment. Euthanasia was performed in each group on days 3, 7, and 14 after surgery. Rats were anesthetized with 1% pentobarbital (40 mg/kg, intraperitoneally) in accordance with previous protocols [14]. A T9 laminectomy was performed to expose the T10 segment of the spinal cord. The dura was cut using a pair of fine ophthalmic scissors, and the T10 spinal segment was completely transected without removal of the cord tissue. In the control group, EA group, and the NAEA group, a piece of gel foam (1├Ś 2├Ś 2 mm3, prewetted with 5 ╬╝L of DMEM) was inserted into the 1-mm wide lesion in the spinal cord. In the MSCs and MSCs+EA groups, another piece of gel foam that had been soaked with a suspension of MSCs (1 ├Ś105 cells/╬╝L; 5 ╬╝L) was placed into the lesion site of the spinal cord. Following surgery and the gel foam implantation, the incisions were closed layer-by-layer; the rats were then returned to their own cages with a thick layer of soft bedding. All animals received intensive care including an intramuscular injection of penicillin (160,000 U/mL/rat/day) for 3 days, and urine was released manually twice daily. The rats in the EA, NA-EA, and MSCs+EA groups received EA treatment every other day, beginning on the first day after spinal cord transection and then on days 3, 7, and 14. EA treatments were performed at the selected acupoints or nonacupoints, respectively.
4. EA Treatment
As described in our previous study [14], we selected 2 pairs of Governor Vessel acupoints for the EA treatment (Supplementary Fig. 1). The first pair of acupoints was Changqiang (GV1) and Yaoshu (GV2), while the other pair was Jizhong (GV6), and Zhiyang (GV9). The GV1 acupoint is located at the midpoint between the tip of the coccyx and the anus, with the animal in the prone position. The GV2 acupoint is located on the posterior midline and in the depression below the spinous process of the fourth sacrum. The GV6 and GV9 acupoints are located at the interval of the T11ŌĆō12 and T7ŌĆō8 spinous processes, respectively. In addition, we set up a nonacupoint EA treatment (the NA-EA group) as a control to further investigate the therapeutic specificity of the acupoints. The nonacupoint was located 10ŌĆō13 mm lateral of each corresponding acupuncture point. For the EA and MSCs+EA groups, 2 pairs of stainless needles (0.3 mm in diameter) were inserted to a depth of 5 mm into the GV1 and GV2 acupoints and the GV6 and GV9 acupoints. For the NA-EA group, the treatment was delivered subcutaneously by oblique insertion to a depth of approximately 5 mm at the nonacupoint. During EA treatment, rats were loosely immobilized in a specially made restrainer in which the head, dorsal spines, hind legs, and tail were exposed. The 2 pairs of needles were connected to the output terminals of an EA application apparatus (Model G 6805-2, Shanghai Medical Electronic Apparatus Company, China). Alternating strings of dense-sparse frequencies (60 Hz for 1.05 seconds and 2 Hz for 2.85 seconds) were selected as reported previously [14]. The intensity was adjusted to induce a slight twitch of the hindlimb (Ōēż 1 mA), and the duration of treatment lasted for 20 minutes.
5. RNA Extraction and Quantitative Real-Time Polymerase Chain Reaction
In all groups, total RNA was extracted from the spinal cord segment (0.5 cm) containing the injury site, on days 3, 7, and 14 after SCI points (5 rats/group), using Trizol (Takara Bio Inc., Kusatsu, Japan) in accordance with the manufacturerŌĆÖs instructions. The concentration of the extracted RNA was measured using a spectrophotometer (NanoDrop 2000, Thermo Fisher Scientific Inc., Waltham, MA, USA) at 260 nm/280 nm. All primers (Invitrogen, Carlsbad, CA, USA) were designed using Primer 5.0 and are listed in Supplementary Table 1. Real-time polymerase chain reaction (PCR) with SYBR green dye (Takara Bio Inc.) was performed on a LightCycler 480 system (Roche Diagnostics, Basel, Switzerland) to detect the initial concentrations of the target genes, using ╬▓-actin as an internal reference.
6. Enzyme-Linked Immunosorbent Assay
Proteins were extracted from spinal cord segments (10-mm length) containing the injury site using ultrasonication in all groups, on days 3, 7, and 14 after surgery (5 rats/group). The protein extract was obtained using centrifugation for 20 minutes at 12,000 g and 4┬░C. The concentration of inflammatory cytokines in the supernatant was then measured using enzyme-linked immunosorbent assay (ELISA) kits (TNF-╬▒, IL-1╬▓, IL-6, and IL-10; Abcam, London, UK) in accordance with the manufacturerŌĆÖs instructions. The concentration of each protein in each sample was normalized based on the total protein concentration determined using the bicinchoninic acid method (Pierce BCA protein assay reagent kit, Thermo Fisher Scientific Inc.).
7. Tissue Preparation and Immunohistochemistry
On days 7 and 14 after the surgery, animals were anesthetized and transcardially perfused with 4% paraformaldehyde in 0.1 M phosphate buffer (PB, pH 7.4). The spinal cord was removed, post-ixed, and then dehydrated in 30% sucrose/PB. Longitudinal cryosections of the spinal cord (including the injury site) were then cut at 20 ╬╝m and mounted on slides. Immunohistochemistry was performed as described previously [14]. Briefly, sections were rinsed with PBS and blocked with 10% normal goat serum and 0.3% Triton X-100 in 0.01 M phosphate buffered saline (PBS, pH 7.4) for 30 minutes at 37┬░C. Next, the sections were incubated with primary antibodies overnight at 4┬░C, including mouse anti-CD68 (1:300, Abcam) for activated microglia/macrophages, rabbit anti-CCR7 (1:250, Abcam) for the M1 phenotype of microglia/macrophages, rabbit anti-CD206 (1:500; Abcam, Cambridge, MA, USA) for the M2 phenotype of microglia/macrophages, mouse anti-GFAP (1:500, Sigma Aldrich, St. Louis, MO, USA) for astrocytes, mouse antichondroitin sulfate clone CS-56 (CSPGs, 1:100, Sigma Aldrich) for glial scars, goat anti-C3 (5 ╬╝g/mL; AF2655, R&D Systems, Minneapolis, MN, USA) for neurotoxic A1 reactive astrocytes, chicken anti-NF200 (1:1,000, Sigma Aldrich) for neurons and axons, rabbit anti-ErbB1 (1:400, Cell Signaling Technology, Danvers, MA, USA), and rabbit anti-p-STAT3 (tyr705; 1:150; Cell Signaling Technology). Subsequently, the sections were rinsed with PBS and incubated with secondary antibodies for 1 hour at 37┬░C. Finally, the sections were rinsed with PBS, coverslipped, and examined under a confocal microscope (LSM-810; Zeiss Inc, Oberkochen, Germany).
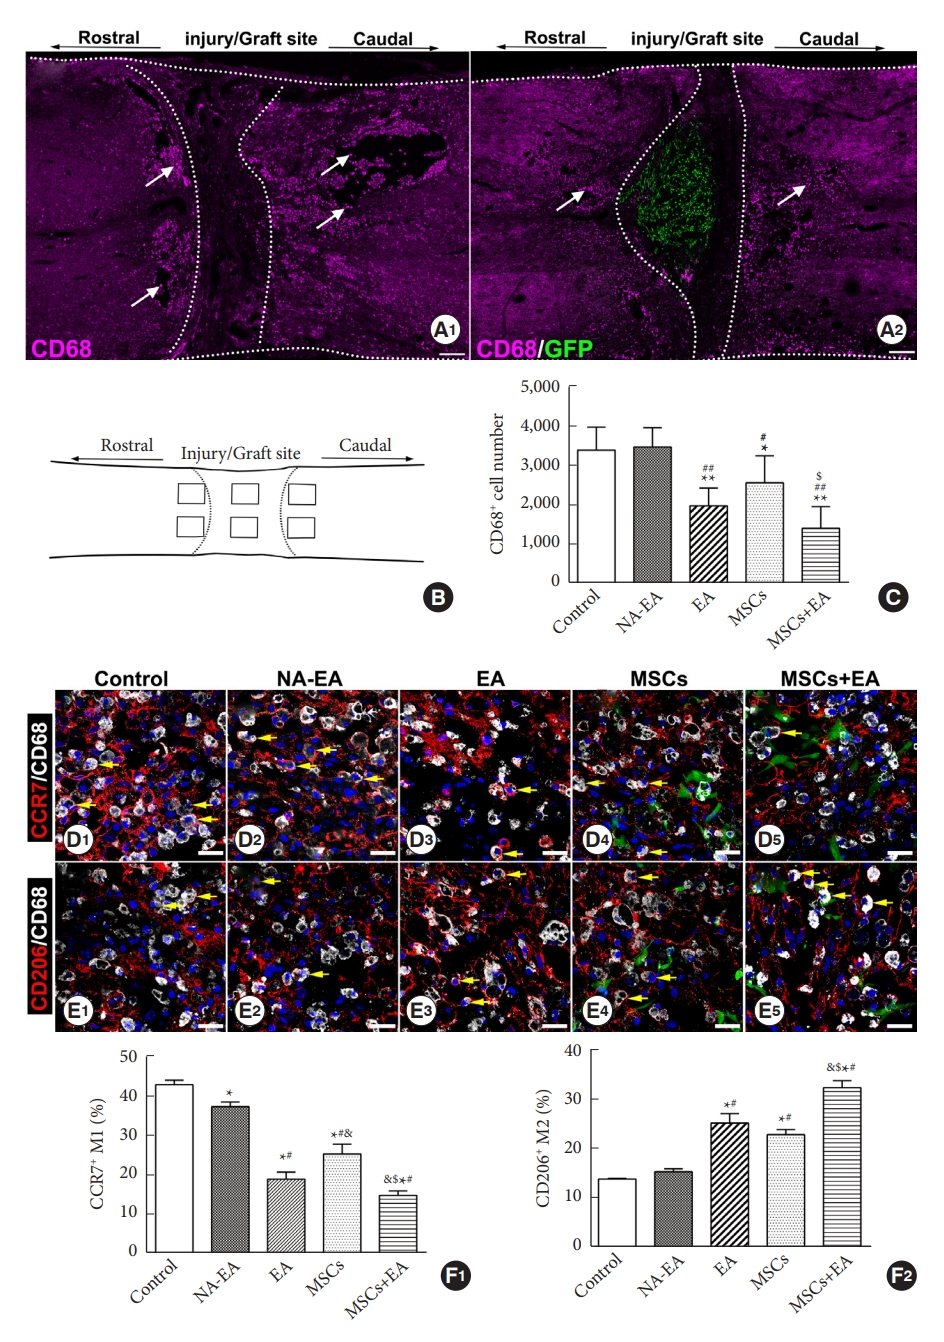
To investigate inflammatory reaction and glial scar formation in vivo, specific testing was performed on one in 5 longitudinal sections of the spinal cord for each animal (6 sections/rat, 5 rats/group). We quantified the number of CD68+ cells and CCR7/CD68 or CD206/CD68 double-positive cells with a well-defined nucleus counterstained by Hoechst 33342 from 6 regions of interests (ROIs) in each section, as depicted in Fig. 1B. Photographs of the selected ROIs (0.44├Ś 0.33 mm2) were taken using a fluorescence microscope, and the total number of positive cells in each photograph was manually counted [22].
Images of 6 sections for each animal were taken under a 10├Ś objective and used for quantification. Using Image J software (National Institutes of Health, Bethesda, MD, USA), we quantified the proportion of GFAP-positive staining (the positive staining area/total area of tissue├Ś 100%) in an area defined as 0.5 mm rostral or 0.5 mm caudal to the interface of the host/lesion site in the longitudinal sections. The proportion of CSPGs that were positively stained were quantified in the 2 mm wide region containing the central lesion site in each longitudinal section.
8. Western Blot Analysis
Western blot analysis was performed using tissue samples on days 3, 7, and 14 after surgery. The spinal cords of rats were immediately removed after deep anesthesia. The spinal cord segment (0.5 cm long) containing the injury/graft site was dissected and homogenized in lysis buffer containing 20 mM Tris at pH 7.5, 150 mM NaCl, 0.2% Triton X-100, and Complete Mini Protease Inhibitor Cocktail (Roche Diagnostics). Equal amounts of each protein sample (20 ╬╝g) were separated by 12% sodium dodecyl sulfate-polyacrylamide gel electrophoresis and then transferred onto a polyvinylidene fluoride membrane. After blocking nonspecific binding sites with 5% nonfat milk in TBST (0.5% Tween 20 in Tris buffered saline) for 1 hour at room temperature, the membrane was incubated overnight at 4┬░C with mouse anti-CD68 (1:1,000, Abcam), rabbit anti-CCR7 (1:5,000, Abcam), rabbit anti-CD206 (1:1,000; Abcam), mouse anti-GFAP (1:4,000, Sigma Aldrich), mouse anti-CSPGs (1:1,000, Sigma Aldrich), rabbit anti-ErbB1 (1:1,000, Cell Signaling Technology) and rabbit anti-p-STAT3 (tyr705; 1:1,000; Cell Signaling Technology), chicken anti-NF200 (1:1,000, Sigma Aldrich), and mouse anti╬▓-actin (1:4,000, Sigma Aldrich). The primary antibodies were then detected with an horseradish peroxidase-conjugated secondary antibody (goat anti-mouse or goat anti-rabbit, 1:5,000, Jackson ImmunoResearch, West Grove, PA, USA) and then visualized with an enhanced chemiluminescence Western blot substrate kit (Applygen Technologies Inc., Beijing, China).
9. Detection of the Effect of Proinflammatory Cytokines on Astrogliosis and the Expression of Key Signaling Molecules In Vitro
Primary rat astrocytes were seeded in a 24-well plate at a density of 1├Ś105 cells/well and incubated overnight to allow recovery of the cells from trypsinization. Then, the serum-containing medium was removed and replaced with a serum-free medium for 24 hours of culture. Astrocytes were treated with TNF-╬▒ (10 ng/mL, R&D Systems) and/or IL-1╬▓ (1 or 10 ng/mL, R&D Systems) in DMEM/F12 supplemented with 2% FBS, for 24 hours for mRNA extraction and analysis, or 48 hours for immunocytochemistry. The quantitative real-time PCR (qRT-PCR) was performed as described above and used to detect the mRNA levels of GFAP and CSPG.
Astrocyte proliferation was determined using Ki67 immunocytochemical staining or 5-ethynyl-2ŌĆÖ-deoxyuridine (EdU) incorporation assays. Ki67 staining was performed as described above. Briefly, cells were incubated with a primary antibody to Ki67 (rabbit anti-rat Ki67, 1:200, Abcam) at 4┬░C overnight. Then, cells were washed with PBS and incubated with Cy3-conjugated goat anti-rabbit IgG (1:300, Jackson Immunoresearch) for 1 hour at 37┬░C. In the EdU incorporation assay, proliferating astrocytes incorporate EdU in their DNA. The EdU incorporation assay was performed with a Cell-Light EdU Apollo 567 DNA In Vitro Kit (Ribobio Co., Ltd., Guangzhou, China) in accordance with the manufacturerŌĆÖs instructions. Briefly, cells were treated with 50 ╬╝M EdU (1:1,000) for 3 hours before fixation with 4% formaldehyde for 30 minutes at room temperature, and then treated with 0.5% Triton X-100 for 10 minutes at room temperature for membrane permeabilization. The cells were then rinsed twice with PBS and stained with 1├Ś Apollo reaction cocktail for 30 minutes. Subsequently, the cell nuclei were stained with Hoechst 33342 (5 ┬Ąg/mL; Sigma Aldrich) for 10 minutes. Ki67- or EdUlabeled cells were quantified using fluorescence microscopy (Leica Camera AG, Wetzlar, Germany) and normalized according to the total number of cells stained with Hoechst 33342 in 5 randomly selected nonoverlapping fields in each well. Assays were performed on 3 independent occasions using triplicate wells.
The cultured astrocytes were seeded in a 6-well plate at a density of 1├Ś106 cells/well and incubated overnight. Then, the serum-containing medium was removed and replaced by serum-free medium for 12 hours of culture. Astrocytes were treated with TNF-╬▒ (10 ng/mL) and IL-1╬▓ (10 ng/mL) in DMEM/F12 supplemented with 2% FBS for 48 hours. Then, the supernatant was removed and washed 3 times with PBS. The cells were collected for Western blotting to detect the expression of GFAP, CSPG, ErbB1, and p-STAT3. If the proinflammatory cytokines (TNF-╬▒ and IL-1╬▓) stimulated the overexpression of GFAP, CSPGs, ErbB1, and p-STAT3 by astrocytes, we used inhibitors (AG1478 and AG490) of ErbB1 and STAT3, respectively, to detect the effect of proinflammatory cytokines (TNF-╬▒ and IL-1╬▓) on the activation of astrogliosis.
10. Statistical Analysis
All data are presented as the mean ┬▒ standard deviation (SD). Multiple comparisons between groups were performed using 1-way analysis of variance. The Shapiro-WilkŌĆÖs test and LeveneŌĆÖs test were conducted to confirm normality of the data. If equal variances were detected, the least significant difference test was applied; otherwise, data exhibiting heterogeneity of variance were analyzed using the nonparametric Kruskal-Wallis test. Statistical significance was as defined as p < 0.05. All statistical analyses were performed using IBM SPSS Statistics ver. 25.0 (IBM Co., Armonk, NY, USA).
RESULTS
1. MSCs and EA Treatment Reduced the Proportion of Microglia/Macrophages and Increased the Proportion of M2 Subtype Cells in Injured Spinal Cord
To investigate the effect of MSC grafts and/or EA on the microglia/macrophages in the injured spinal cord, we performed immunofluorescence double staining to identify and quantify CD68+ activated microglia/macrophages and their subtypes (the CCR7+ CD68+ M1 subtype or the CD206+ CD68+ M2 subtype). Seven days after SCI, many CD68+ cells had accumulated around the injury site and extended rostrally and caudally in all groups (Fig. 1A1, A2). The number of CD68+ cells in the MSCs and/or EA groups were significantly reduced when compared to the control group (p < 0.01) or the NA-EA group (p < 0.01) (Fig. 1C). Notably, in the MSCs+EA group, combination therapy significantly reduced the number of CD68+ microglia/macrophages when compared with the MSCs group (p < 0.05) (Fig. 1C).
The M1 microglia/macrophages phenotype was investigated using double-labeled immunostaining for CD68/CCR7. As shown in Fig. 1D, many CD68+ CCR7+ M1 cells were detected in the injured spinal cord. The CCR7-immunopositive signals were localized mainly in the plasma membrane and cytoplasm of the stained cells. In the control group (Fig. 1D1) and the NA-EA group (Fig. 1D2), there were more CD68+ CCR7+ M1 cells compared to the EA (Fig. 1D3), MSCs (Fig. 1D4), and MSCs+EA (Fig. 1D5) groups. Quantification analysis (Fig. 1F1) showed that the proportion of CD68+ CCR7+ M1 cells in the CD68+ microglia/macrophages was significantly decreased in the EA, MSCs, and MSCs+EA groups compared to the control group or NA-EA group; the proportion of CD68+ CCR7+ M1 cells was significantly reduced in the MSCs+EA group compared to the MSCs and EA groups.
The M2 microglia/macrophage phenotype was detected using double immunostaining for CD68/CD206 in all groups. A considerable number of CD68+ CD206+ M2 cells were identified in the injured spinal cord. The CD206-immunopositive signals were located mainly in the membrane of the stained cells (Fig. 1E). In the control group (Fig. 1E1) and the NA-EA groups (Fig. 1E2), there were relatively fewer CD68+ CD206+ M2 cells than in the EA (Fig. 1E3), MSCs (Fig. 1E4), or MSCs+EA (Fig. 1E5) group. Quantification analysis (Fig. 1F2) showed that the proportion of CD68+ CD206+ M2 microglia/macrophages was higher in the EA, MSCs, and MSCs+EA groups compared to the control group or NA-EA group (p < 0.05); the proportion of CD68+ CD206+ M2 cells in the MSCs+EA group was higher than that in the MSCs or EA groups (p < 0.05).
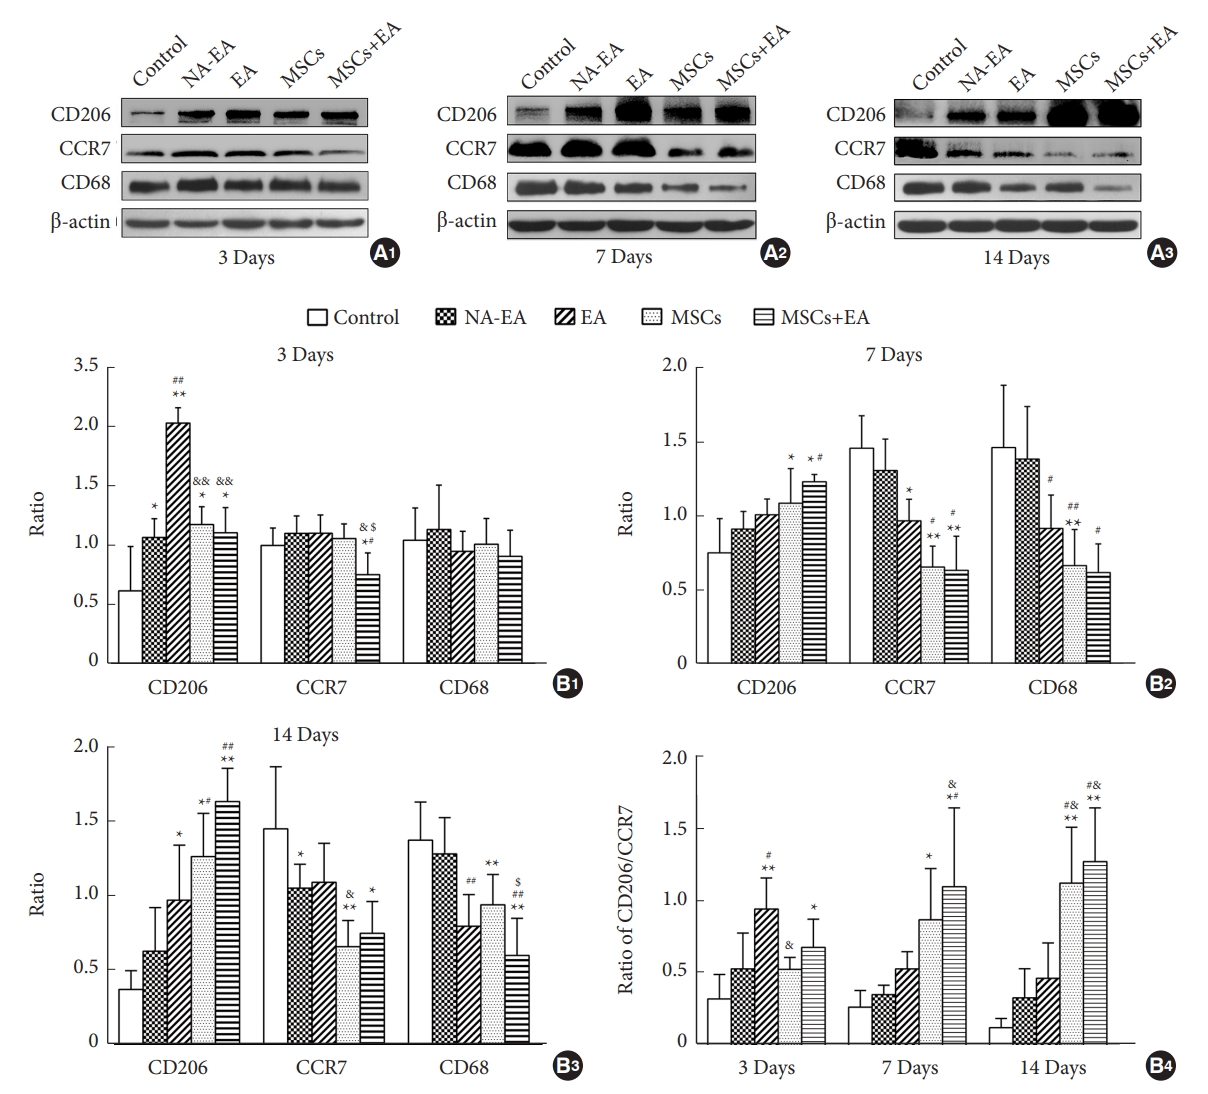
Furthermore, Western blotting analysis of pan-microglia/macrophages (CD68), the M1 subtype (CCR7) and the M2 subtype (CD206) of microglia/macrophages showed a similar trend of changes as with the immunocytochemical results for each group. On day 3 after SCI, the expression levels of CD68 protein did not differ significantly when compared across the 5 groups. However, following treatment with EA and/or MSCs at the corresponding time point, the expression levels of CD206 protein (an M2 marker) were significantly increased, while those of CCR7 (an M1 marker) were significantly reduced when compared with the control group and the NA-EA group (Fig. 2A1, B1). EA treatment significantly increased the expression of CD206 protein at this time point when compared to the MSCs group or MSCs+EA group (Fig. 2A1, B1). On day 7, treatment with MSCs and/or EA significantly reduced the protein expression of CD68 and CCR7 but increased the protein expression of CD206 when compared with the control group or the NA-EA group (Fig. 2A2, B2). On day 14, treatment with MSCs and/or EA significantly decreased the expression of CD68 and CCR7 proteins but significantly increased the expression of CD206 protein as compared with the control group or the NA-EA group (Fig. 2A3, B3). Notably, the protein expression of CD68 in the MSCs+EA group was significantly downregulated when compared with the MSCs group at this time point (Fig. 2A3, B3). In addition, the CD206/CCR7 (M2/M1) ratio increased steadily and was maintained at a higher level in the MSCs+EA group from day 3 to day 14 when compared with the control group or the NA-EA group (Fig. 2B4). Furthermore, the CD206/CCR7 (M2/M1) ratio in the MSCs+EA group was higher than that in the EA or MSCs groups on days 7 and 14 after SCI (Fig. 2B4). Collectively, these data indicate that the combination of MSCs and EA therapy could significantly attenuate the microglia/macrophage response and enhance the polarization of M2 microglia/macrophages in the injured spinal cord.
2. MSCs and EA Treatment Attenuated the Inflammatory Response
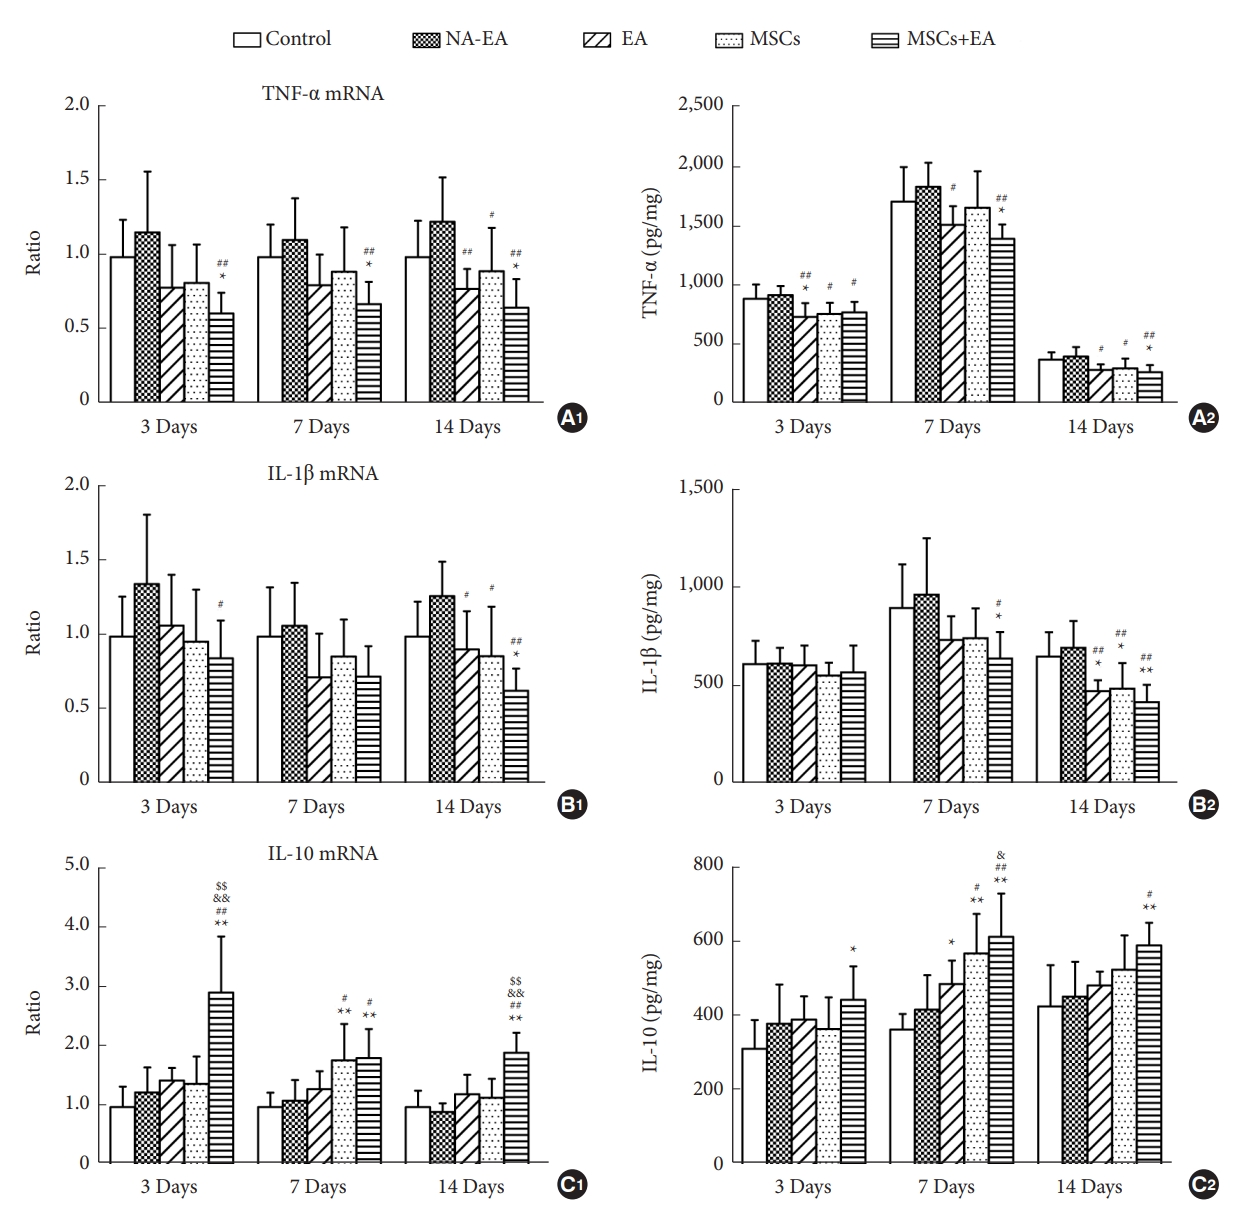
To investigate the effect of MSCs and/or EA treatment on inflammatory responses following SCI, we measured the mRNA or protein expression levels of TNF-╬▒, IL-1╬▓, and IL-10 at the injury site in the spinal cord on days 3, 7, and 14 postinjury via qRT-PCR and ELISA, respectively. As shown in Fig. 3A, treatment with MSCs and/or EA downregulated the mRNA and protein expression of TNF-╬▒ on days 3, 7, and 14. The decrease in the mRNA expression level of TNF-╬▒ in the MSCs+EA group was pronounced at all 3 time points; similarly, the protein expression levels of TNF-╬▒ in the MSCs+EA group were significantly reduced on days 7 and 14 compared to the control group and the NA-EA group (Fig. 3A1, A2). In addition, relative to the NA-EA group, the mRNA levels of TNF-╬▒ in the EA group were reduced only on day 14 (Fig. 3A1), although the protein expression levels of TNF-╬▒ in the EA group were significantly reduced at all 3 time points (Fig. 3A2). A similar tendency for change was observed in the mRNA and protein expression levels of IL-1╬▓ in all groups and at all 3 time points (Fig. 3B1, B2). On day 14, EA or MSCs treatment, but especially the combined therapy (MSCs+EA) downregulated the mRNA and protein expression levels of IL-1╬▓ when compared with the control group or the NA-EA group. In contrast, the mRNA and protein levels of the anti-inflammatory cytokine IL-10 showed a steady increase in the MSCs+EA group compared to the Control and NA-EA groups at all 3 time points (Fig. 3C1, C2). Moreover, the mRNA expression levels of IL-10 in the MSCs+EA group on days 3 and 14 were significantly increased when compared with the MSCs group or the EA group (Fig. 3C1). The levels of IL-10 protein in the MSCs+EA group on day 7 were higher than those in the EA group (Fig. 3C2). These data indicate that the combined MSCs+EA therapy was more effective in reducing the levels of proinflammatory cytokines (TNF-╬▒ and IL-╬▓) and increasing the levels of the anti-inflammatory cytokine IL-10 in the transected spinal cord.
3. MSCs and EA Treatment Reduced the Formation of Glial Scars
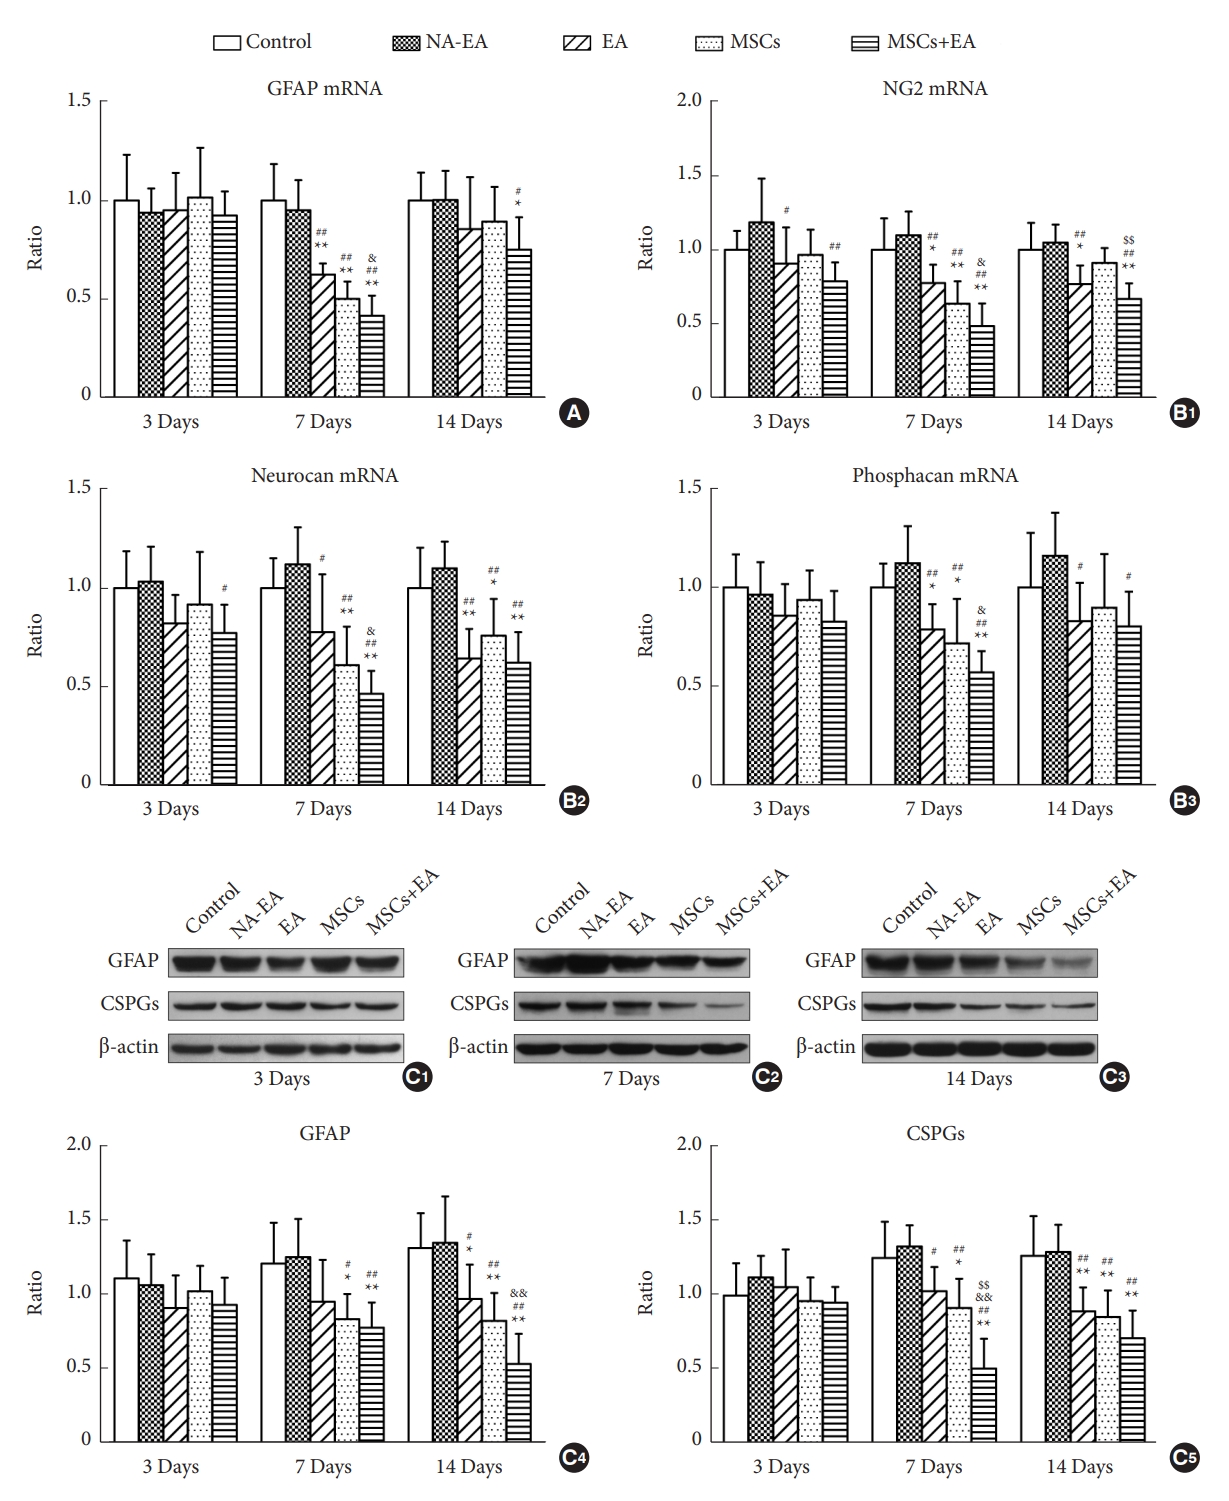
Quantitative real-time PCR and Western blotting were used to investigate the expression levels of GFAP and CSPGs in the spinal cord on days 3, 7, and 14 after injury (Fig. 4). On day 3, there was no significant difference in the mRNA and protein expression levels of GFAP when compared across groups (Fig. 4A, C1, and C4). However, on days 7 and 14, EA and/or MSCs treatment reduced the mRNA and protein expression of GFAP when compared with the Control and NA-EA groups (Fig. 4A, C2ŌĆōC4). The combined therapy of MSCs+EA reduced the mRNA and protein expression of GFAP significantly when compared with EA treatment on days 7 and 14, respectively (Fig. 4A, C2ŌĆōC4).
Quantitative real-time PCR analysis of other factors in the glial scars showed a similar trend of change as described above. The mRNA expression levels of CSPGs core proteins, including NG2, neurocan, and phosphacan was all reduced after treatment with EA and/or MSCs at all 3 time points (Fig. 4B1ŌĆōB3). The combined MSCs+EA therapy significantly attenuated the mRNA expression of NG2, neurocan, and phosphacan when compared with the control group, NA-EA group, and EA group on day 7 after SCI (Fig. 4B1ŌĆōB3). Furthermore, there was no significant difference in the expression of CSPGs protein when compared across all 3 groups on day 3 (Fig. 4C1, C5). The expression of CSPGs protein was significantly reduced in the EA, MSCs, and MSCs+EA groups when compared with the control group or the NA-EA group on days 7 and 14 (Fig. 4C2, C3, and C5). On day 7, the MSCs+EA treatment significantly downregulated the protein expression of CSPGs when compared with the EA group or the MSCs group (Fig. 4C2, and C5). These results strongly indicate that the combined MSCs+EA treatment effectively reduced reactive astrogliosis and glial scar formation after SCI.
Fourteen days after SCI, extensive GFAP and CSPGs immunostaining was observed at the injury site in the spinal cord, thus indicating the formation of glial scarring at the site of injury in the spinal cord (Fig. 5). Intense GFAP immunoreactivity was detected predominantly in the spinal cord tissue adjacent to the injury site, especially in the control group (Fig. 5A1) and the NA-EA group (Fig. 5B1); however, GFAP immunoreactivity was reduced in the EA (Fig. 5C1), MSCs (Fig. 5D1), and MSCs+ EA (Fig. 5E1) groups. The area occupied by GFAP+ tissue in the MSCs+EA group was significantly lower than that in the Control or NA-EA groups (Fig. 5F1). CSPGs immunoreactivity was localized at the site of injury and the border of the cystic cavities in the injured spinal cord on day 14 in the control (Fig. 4A2), NA-EA (Fig. 5B2), EA (Fig. 5C2), MSCs (Fig. 5D2), and MSCs+ EA (Fig. 5E2) groups. The area occupied by CSPGs+ tissue was significantly reduced in the MSCs group and the MSCs+EA group when compared with the Control or NA-EA group (Fig. 5F2). Notably, the MSCs+EA group showed a significant reduction in the area occupied by CSPGs+ tissue when compared with that in the MSCs group or EA group (Fig. 5F2).
4. Proinflammatory Cytokines Induced Astrogliosis by Upregulating the ErbB1-STAT3 Signal Pathway
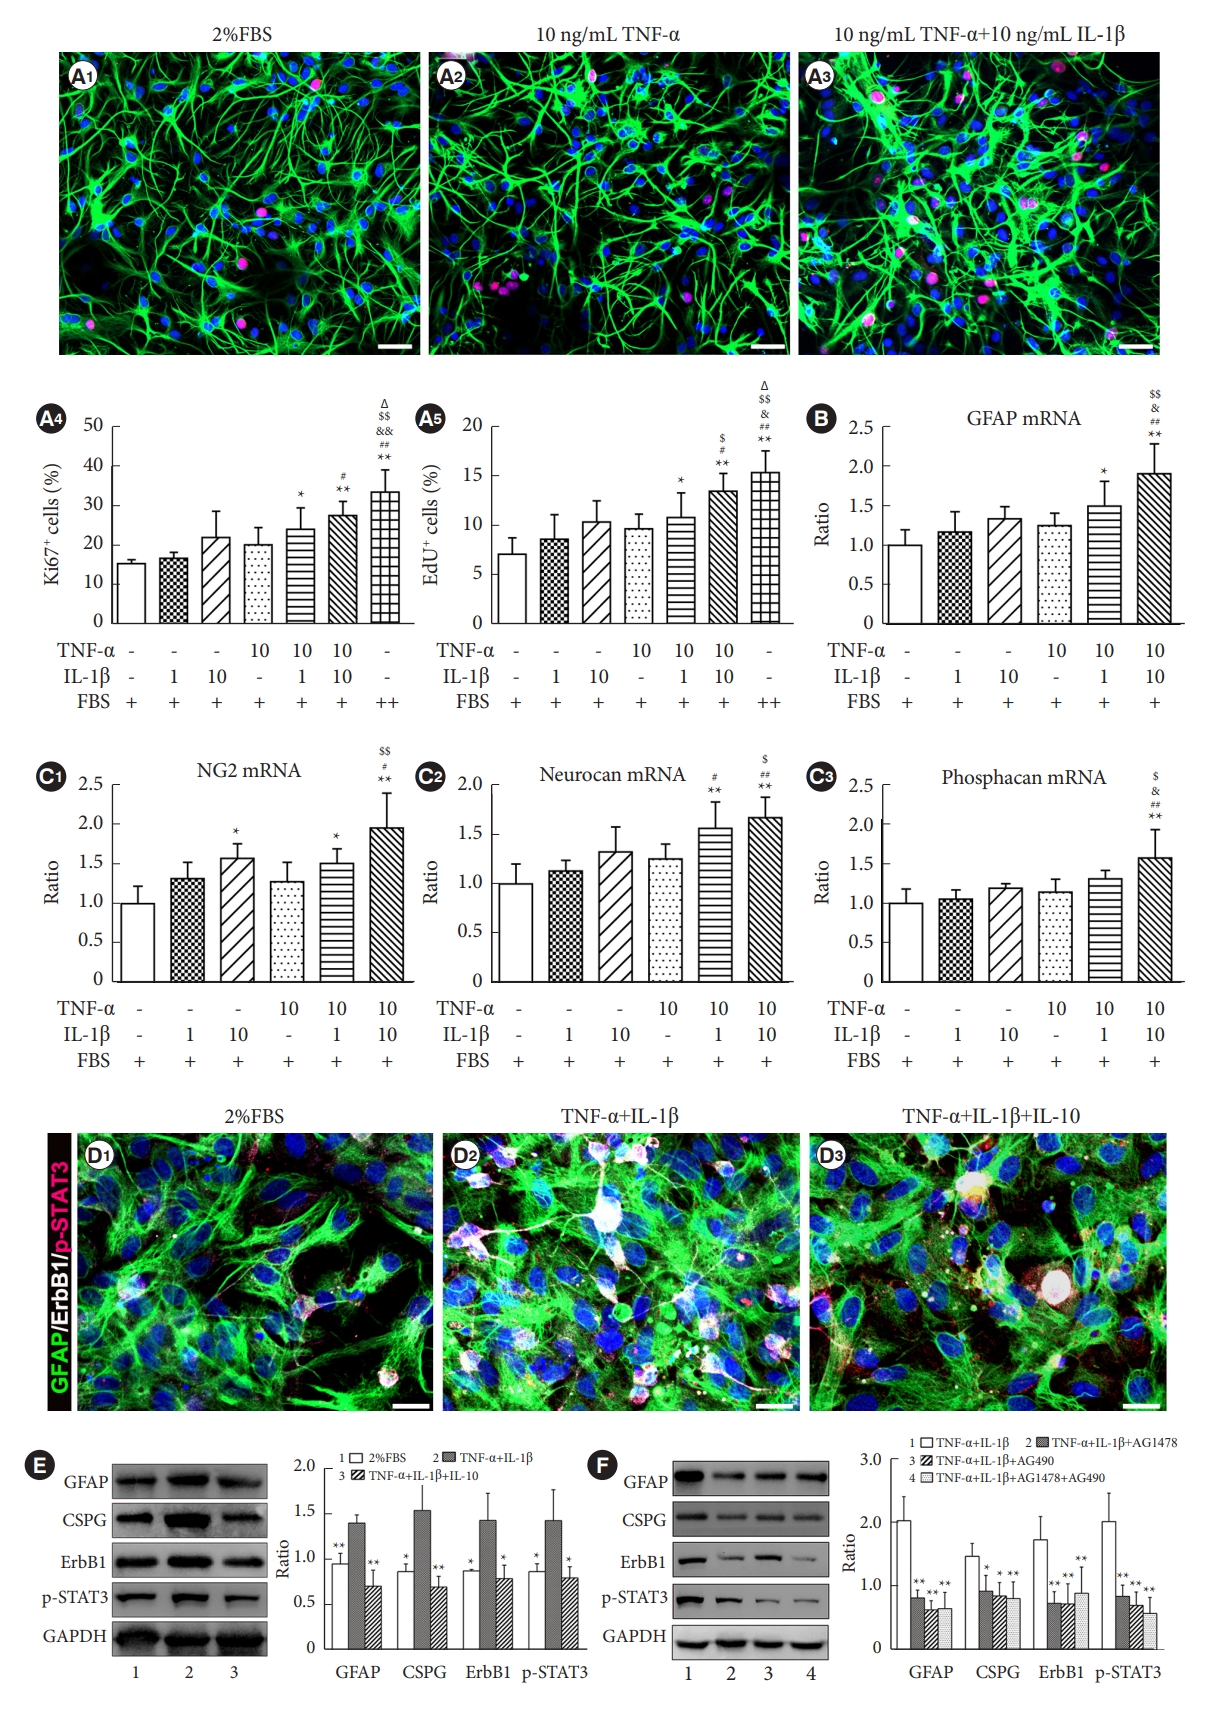
Next, to determine whether proinflammatory cytokines (TNF-╬▒ and IL-1╬▓) could induce astrocyte activation in vitro, we investigated astrocyte proliferation and the mRNA expression levels of GFAP and CSPGs in primary cultured murine astrocytes following TNF-╬▒ and/or IL-1╬▓ stimulation. Astrocyte proliferation was assessed by Ki67 immunocytochemical staining and EdU incorporation assays. Analysis showed that astrocytes exhibited moderate Ki67 immunoreactivity only when incubated with DMEM/F12 supplemented with 2% FBS (Fig. 6A1). However, the incidence of Ki67 positive astrocytes increased after the addition of TNF-╬▒ (10 ng/mL) and/or IL-1╬▓ (10 ng/mL) into the culture medium containing 2% FBS (Fig. 6A2, A3). The astrocyte proliferation rate was determined by determining the proportion of Ki67+ or EdU+ cells out of the total GFAP+ cell population labeled using the nuclear dye Hoechst 33342. TNF-╬▒ and/or IL-1╬▓ increased the proliferation of astrocytes in a dose-dependent manner, and the combination of TNF-╬▒ (10 ng/mL) and IL-1╬▓ (10 ng/mL) was most efficacious in promoting the proliferation of astrocytes (Fig. 6A4, A5). The mRNA expression levels of GFAP and CSPGs in astrocytes was assessed via qRT-PCR after TNF-╬▒ and/or IL-1╬▓ stimulation in vitro. Treatment with TNF-╬▒ or IL-1╬▓ in astrocytes triggered a moderate increase in GFAP mRNA expression (Fig. 6B). When treated with a combination of TNF-╬▒ (10 ng/mL) and IL-1╬▓ (10 ng/mL), the astrocytes exhibited a marked increase in GFAP mRNA expression (Fig. 6B). The mRNA expression levels of CSPGs core proteins, such as NG2, neurocan, and phosphacan were all increased after combined treatment with TNF-╬▒ (10 ng/mL) and IL-1╬▓ (10 ng/mL) (Fig. 6C1ŌĆōC3). These results suggest that TNF-╬▒ and IL-1╬▓ could promote astrocyte proliferation and the mRNA expression of GFAP and CSPGs in vitro.
In addition, when astrocytes were treated with TNF-╬▒ (10 ng/mL)+IL-1╬▓ (10 ng/mL) in DMEM/F12 supplemented with 2% FBS for 48 hours, the number of GFAP/ErbB1/p-STAT3 colabeled astrocytes was higher than that in the 2% FBS group or the TNF-╬▒+IL-1╬▓+IL-10 group (Fig. 6D1ŌĆōD3). Western blotting analysis also showed that the expression levels of GFAP, CSPGs, ErbB1, and p-STAT3 were significantly increased when astrocytes were stimulated with TNF-╬▒+IL-1╬▓ for 48 hours compared with the 2% FBS group and the TNF-╬▒+IL-1╬▓+IL-10 group (Fig. 6E). To verify that proinflammatory cytokines (TNF-╬▒ and IL-1╬▓) could stimulate astrogliosis by activating the ErbB1-STAT3 signal pathway, we added specific inhibitors of ErbB1-STAT3 (AG1478 and AG490). Western blot analysis showed that the ErbB1 inhibitor AG1478, JAK2/STAT3 inhibitor AG490, and the combination of AG1478 and AG490 markedly reduced the expression of GFAP, CSPGs, ErbB1, and p-STAT3 in astrocytes treated with TNF-╬▒+IL-1╬▓ (Fig. 6F). These results demonstrated that IL-10, AG1478, and/or A490 could partially block the stimulatory effect of proinflammatory cytokines on astrocytes to express GFAP and CSPGs by inhibiting the ErbB1-STAT3 signal pathway.
5. MSCs and EA Treatment Downregulated the ErbB1-STAT3 Signal Pathway
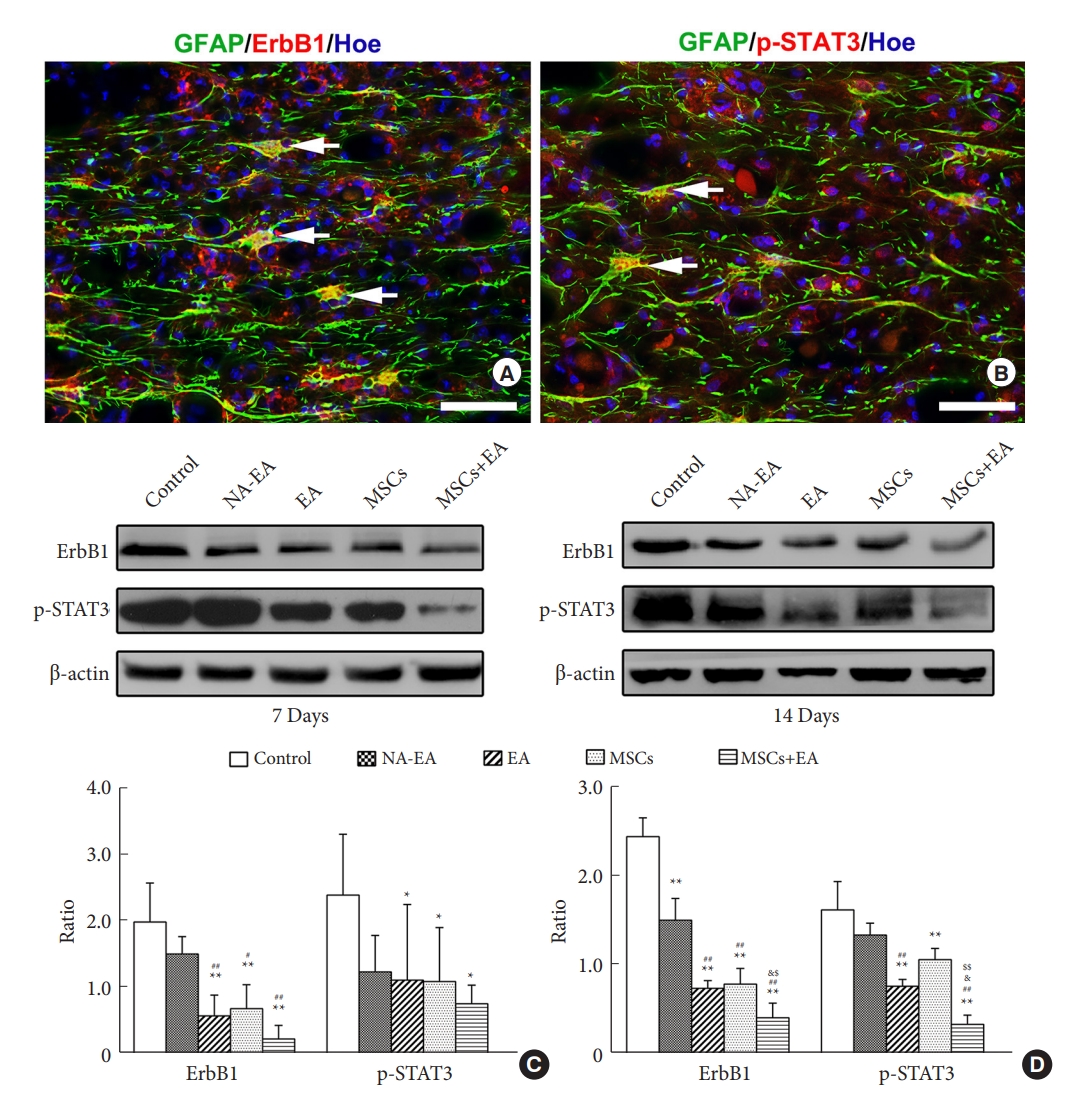
To investigate the possible mechanism involved in the inhibition of glial scar formation by MSCs+EA treatment, we detected the expression of ErbB1 and p-STAT3, which is related to reactive astrogliosis and glial scar formation. GFAP/ErbB1 and GFAP/p-STAT3 double immunofluorescence labeling showed that astrocytes surrounding the lesion site expressed ErbB1 and p-STAT3 on day 7 after SCI (Fig. 7A, B). Western blotting showed that the protein expression of ErbB1 and p-STAT3 in the EA, MSCs, and MSCs+EA groups were significantly reduced when compared with the control group and NA-EA group on days 7 and 14 after SCI (Fig. 7C, D). Notably, the expression of ErbB1 and p-STAT3 proteins in the EA+MSCs group was significantly lower than that in the EA group or the MSCs group (Fig. 8C, D). These results suggested that MSCs+EA treatment can suppress the activation of ErbB1-STAT3 and downregulate the expression of the proinflammatory cytokines, GFAP, and CSPGs.
6. MSCs and EA Treatment Reduced the Number of C3+ Neurotoxic A1 Astrocytes
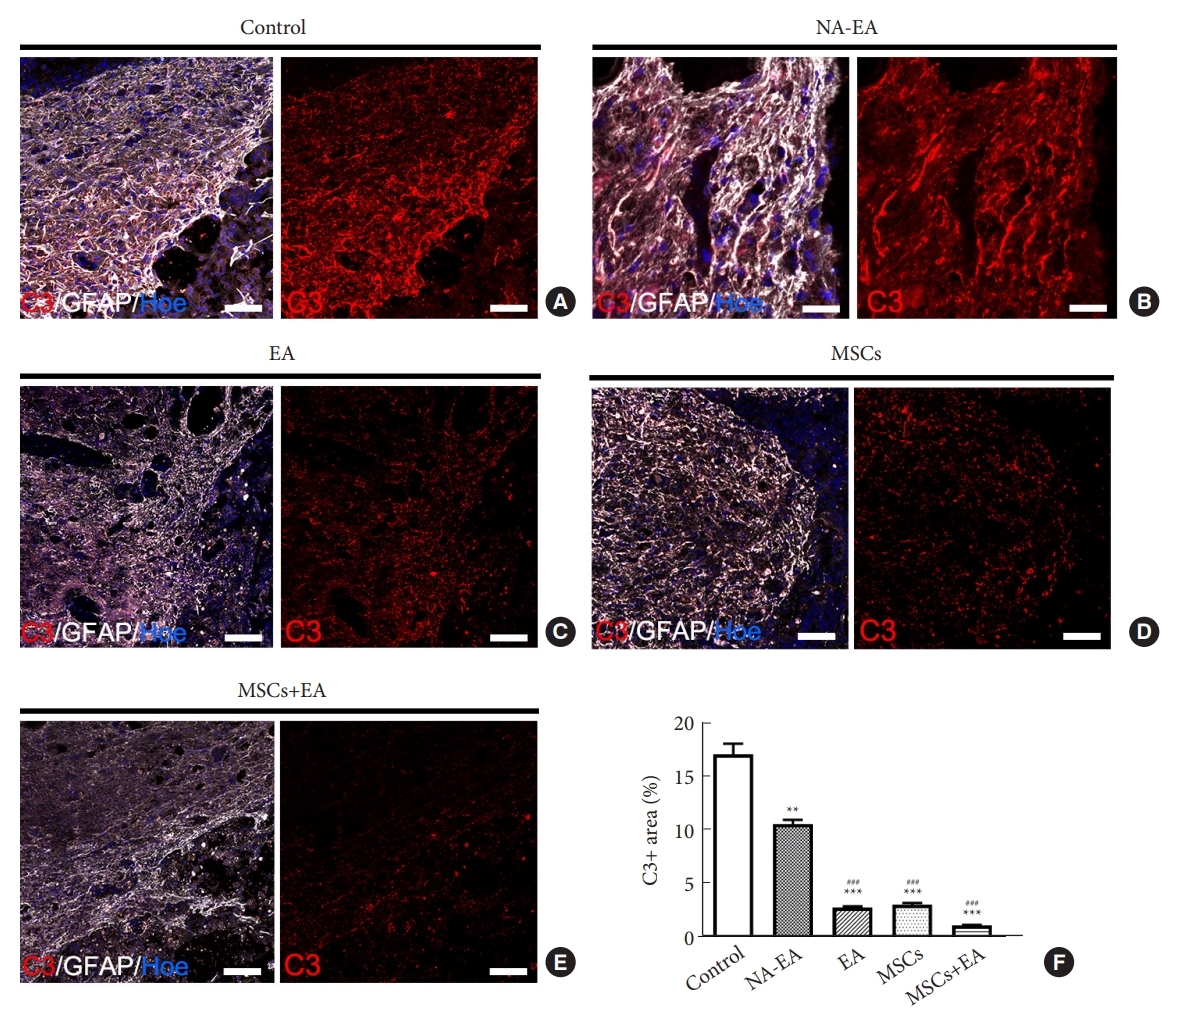
To investigate the effect of MSCs+EA treatment on the subtype of reactive astrocytes following SCI, we investigated the expression of complement component C3 (a marker of A1 reactive astrocytes) in the injured spinal cord on day 14 after SCI. C3/GFAP double-labeled A1 astrocyte immunostaining demonstrated that intense C3 immunoreactivity was detected mainly in GFAP+ astrocytes adjacent to the injury site, especially in the control group (Fig. 8A) and the NA-EA group (Fig. 8B); however, C3 and GFAP immunoreactivity was reduced in the EA (Fig. 8C), MSCs (Fig. 8D), and MSCs+EA (Fig. 8E) groups. In the MSCs+EA group, the area occupied by C3-immunopositivity was significantly lower in the injured spinal cord when compared with other groups (Fig. 8F). These results indicated that MSCs+EA treatment suppressed the expression of C3 and reduced the density of neurotoxic A1 astrocytes in the injured spinal cord.
In addition, we detected the effect of MSCs on the A1 reactive astrocytes induced by conditioned medium (MCM) from lipopolysaccharide (LPS)-induced M1 macrophages in vitro. These data showed that the proinflammatory MCM derived from M1 macrophages (M1-MCM) strongly induced a greater number of astrocytes expressing C3 than the control group (only supplemented with 2% FBS in the basal culture medium). Notably, the cytokines secreted by MSCs reduced the number of C3+ GFAP+ A1 reactive astrocytes induced by M1-MCM (Supplementary Fig. 2).
7. MSCs and EA Treatment Promoted Axonal Regeneration
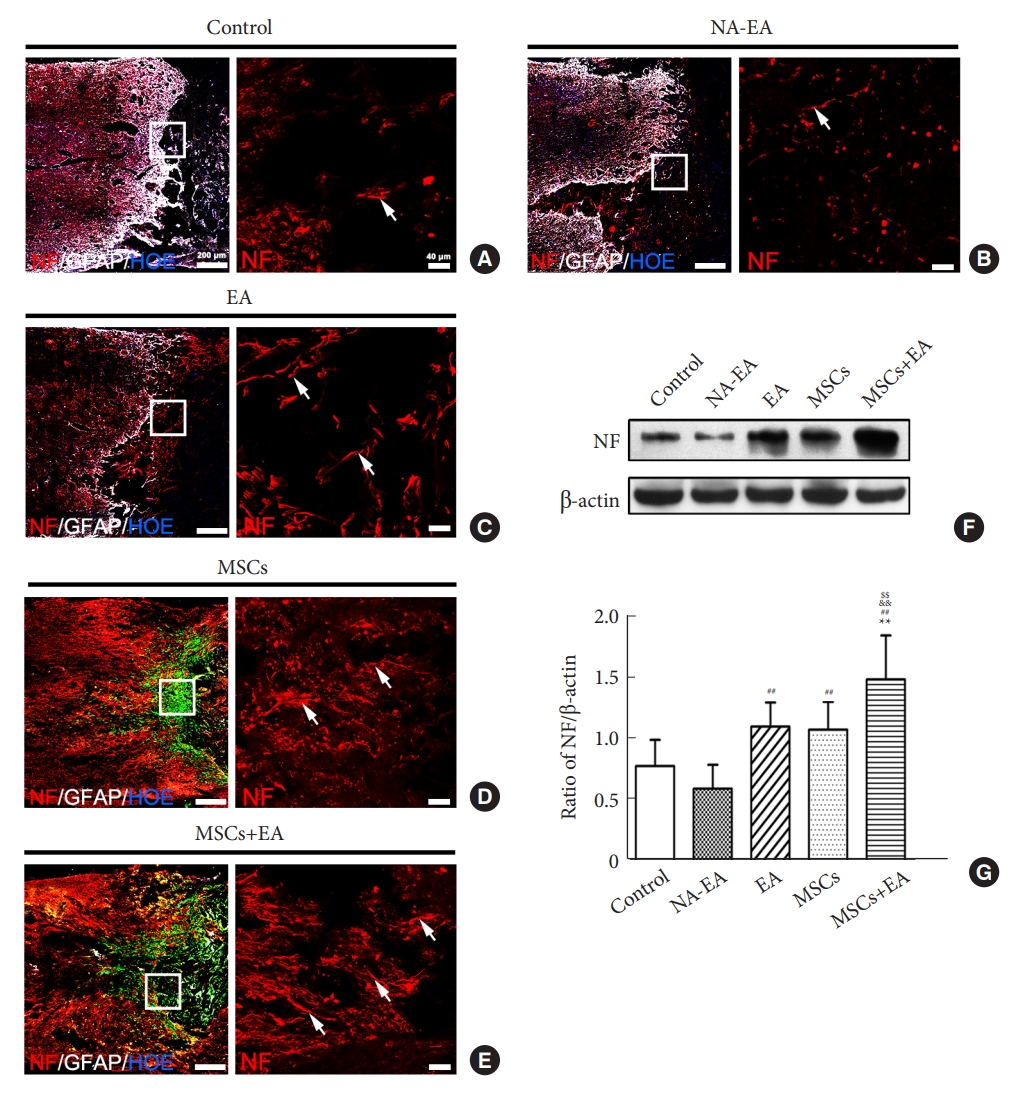
To quantify the regeneration of host axons in the injured spinal cord on day 14 after SCI, we performed NF/GFAP immunostaining and Western blotting. Immunostaining showed that there was a greater number of NF+ axons around the injury site after MSCs grafting and/or EA treatment (Fig. 9AŌĆōE). As compared with the Control or NA-EA groups, there were more NF+ axons in the rostral and caudal areas to the injury/graft site and regenerating into the injury site in the EA, MSCs, and MSCs+EA groups (Fig. 9AŌĆōE). In the MSCs+EA group, the NF+ axons in the injury site were more than that in the other groups (Fig. 9E). Furthermore, Western blot analysis showed that the expression of neurofilament (NF) protein in the EA+MSCs group was significantly higher than that in the control, NA-EA, EA, and MSCs groups (Fig. 9F, G).
DISCUSSION
Regulating the responses of microglia/macrophages and astrocyte and limiting scar formation after SCI have been considered a promising option for creating a favorable environment that is conducive to axonal regeneration. In our previous study, we demonstrated that the transplantation of MSCs combined with EA treatment significantly downregulated the production of GFAP and CSPGs and improved axonal regeneration and neural function at the 8th week after spinal cord transection [14]. However, the specific mechanisms underlying the combined action of MSCs and EA treatment in downregulating the production of GFAP and CSPGs has not been fully elucidated. In the present study, we investigated whether the transplantation of MSCs combined with EA treatment could reduce the number of microglia/macrophages and promote the polarization of M2 microglia/macrophages to inhibit the inflammatory response and attenuate neurotoxic A1 reactive astrocytes and glial scar formation following SCI. We found that MSCs+EA treatment attenuated the activation of macrophages with a concomitant increase in the anti-inflammatory M2 phenotype of microglia/macrophages. Furthermore, MSCs+EA treatment significantly reduced the extent of trauma induced-neurotoxic A1 reactive astrocytes and glial scar formation. In vitro studies also confirmed that proinflammatory cytokines (TNF-╬▒ and IL-1╬▓) stimulated reactive astrogliosis and the expression of GFAP and CSPGs by activating the ErbB1-STAT3 signal pathway, and that the cytokines secreted by MSCs reduced the number of C3+/GFAP+ A1 reactive astrocytes induced by the conditioned medium from LPS-induced M1 macrophages. Taken together with the results of our previous study [14,15], the current findings suggest that MSCs+ EA treatment may help to ameliorate the inflammatory environment by reducing the number of microglia/macrophages and by facilitating the polarization of M2 microglia/macrophages, thus reducing the number of neurotoxic A1 astrocytes, astrogliosis, and astrocytic glial scar formation by downregulating the ErbB1-STAT3 pathway. This would consequently provide a favorable environment that promotes axonal extension after SCI.
Microglia are resident macrophages of the central nervous system [35]. Disruption of the blood-spinal cord barrier after SCI results in the activation of residential microglia and the infiltration of immune cells from the blood stream, including monocytes (which become macrophages after entry into the spinal cord) to the injury site [2,36]. These inflammatory cells release a plethora of proinflammatory mediators, including TNF-╬▒, IL-1╬▓, IL-6, and interferon gamma (IFN-╬│) [37,38]. Endogenous microglia-derived and recruited monocyte-derived macrophages are difficult to distinguish in the injured spinal cord. Thus, herein, the resident microglia and infiltrating macrophages are commonly referred to as macrophages. We show that MSCs combined with EA treatment effectively reduced the activation of macrophages, the population of proinflammatory M1 macrophages, and the expression of mRNA and protein, and proinflammatory cytokines (TNF-╬▒ and IL-1╬▓). In this study, the TNF-╬▒ mRNA level did not fully match its protein level detected using ELISA at 3 and 7 days after SCI. The imperfect mRNAŌĆōprotein correlations of TNF-╬▒ were thought to be due to biological (for example, posttranscriptional regulation) reasons. The protein expression level is regulated not only during transcription (such as mRNA) but also during post-transcription, translation, and posttranslation [39,40]. Concurrently, there was an increased incidence of anti-inflammatory M2 microglia/macrophages and the expression of the anti-inflammatory cytokine IL-10 in the injured spinal cord. Tang et al. [18] previously reported that early EA treatment could ameliorate the activation of microglia and astrocytes and the expression of TNF-╬▒ and promote functional recovery after traumatic brain injury in rats. In another study, EA was shown to inhibit CFA-induced glia activation and the expression of proinflammatory cytokines, including IL-1╬▓, IL-6, and TNF-╬▒ in the spinal cord of a rat model of monoarthritis [41]. All available experimental evidence supports the monoarthritic present argument that EA has an anti-inflammatory effect [16-18,42]. The mechanism involved in EA anti-inflammatory activity may involve activation of the hypothalamus-pituitary-adrenal axis and the cholinergic anti-inflammatory reflex of the nervous system, the downregulation of pattern-recognition receptor activation, thus inducing the MAPK and NF-╬║B pathways, and the regulation of macrophage polarization [43-45]. In addition, many studies have demonstrated that MSCs can promote the polarization of macrophages from the M1 phenotype toward the anti-inflammatory M2 phenotype [24-27]. MSCs may regulate the polarization of macrophages from the M1 toward the M2 phenotype via a contact-dependent and paracrine mechanism involving an interleukin-1 receptor antagonist, TNF-╬▒ stimulated gene/protein 6, prostaglandin E2, and the anti-ROS protein stanniocalcin-1 [24,46]. The present results suggest that the anti-inflammatory effect of the combined MSCs+EA treatment may act, at least in part, by reducing the number of activated macrophages and by inducing the polarization of M2 macrophages, thus changing their functionality from a proinflammatory to an anti-inflammatory status.
In addition, we found that a reduction in M1 microglia/macrophages and an increase in M2 microglia/macrophages were associated with a reduction in the proinflammatory response and the suppression of neurotoxic A1 astrocytes and glial scar formation following EA or/and MSCs treatment. The combined (MSCs+EA) therapy exhibited the most potent effect in downregulating the production of GFAP, CSPGs, and C3 as well as the formation of glial scars. This effect may be attributed to the polarization of macrophages from the M1 to the M2 phenotype, the downregulation of proinflammatory cytokines, and the upregulation of anti-inflammatory factors. The synergistic effect of MSCs+EA treatment increased the levels of IL-10 in the injured spinal cord. Our previous study reported that EA increased the levels of NT-3 in the injured spinal cord to promote the survival of transplanted MSCs [15,47], which could augment the paracrine activity of MSCs to induce anti-inflammatory and antiapoptotic effects. Furthermore, there is growing evidence indicating that the proinflammatory cytokines produced by the injury activated M1 phenotype microglia/macrophages, specifically TNF-╬▒, IL-1╬▒, and IL-1╬▓, could mediate reactive astrogliosis, the increase in neurotoxic reactive A1 astrocytes, and the formation of glial scars [7-9]. Our results further confirmed that EA and/or MSCs treatment could downregulate the expression of GFAP, CSPGs, ErbB1, and p-STAT3 and glial scar formation on days 7 and 14 after SCI. Further, in vitro results demonstrated that proinflammatory cytokines increased the proliferation of astrocytes and stimulated astrocytes to express high levels of GFAP, CSPGs, ErbB1, and p-STAT3. Furthermore, inhibitors of ErbB1 and STAT3 (AG1478 and AG490) effectively blocked the expression of GFAP and CSPGs by inhibiting the ErbB1-STAT3 signal pathway. Other studies have reported that proinflammatory cytokines, especially TNF-╬▒ and IL-1╬▓, act as the initial triggers for reactive astrocytes in the acute phase of SCI [48]. EGFR (ErbB1) activation and STAT3 signaling in reactive astrocytes are required for glial scar formation after SCI [31,33,34,49]. It has also been reported that ErbB1 inhibitors can ameliorate excessive astrogliosis and promote axonal regeneration and functional recovery in adult rats with SCI [50]. The specific ablation of STAT3 in reactive astrocytes is known to result in defective glial scars [31,51]. In addition, in the present study, we found that IL-10 reduced the expression of GFAP, CSPGs, ErbB1, and p-STAT3 in astrocytes activated by proinflammatory cytokines. IL-10, which inhibits the proinflammatory response, has been shown to reduce astrocyte proliferation and glial scar formation [51,52]. Our present findings concur with these earlier reports. Furthermore, IL-10 can induce the shift of microglia/macrophages from a proinflammatory M1 phenotype to an anti-inflammatory/prorepair M2 phenotype [51]. IL-10 may play an essential role in the dialog between infiltrating macrophages and astrocyte-mediated extracellular matrix depositions following SCI [51,53]. IL-10 can also stimulate the production of TGF-╬▓ by astrocytes, which in turn, attenuates microglial activation.54 In addition, many studies have demonstrated that MSCs can promote the polarization of microglia/macrophages from a proinflammatory M1 phenotype toward an anti-inflammatory M2 phenotype to modify the inflammatory environment [24,26,27]. Some recent studies have reported that the MSCs and exosomes derived from MSCs can efficiently suppress inflammation following traumatic SCI and suppress the activation of A1 neurotoxic reactive astrocytes [28,55]. Collectively, our in vivo and in vitro results suggest that the combination of MSCs and EA treatment could attenuate the activation of microglia/macrophages and the inflammatory response, thus inhibiting the proliferation of astrocytes, neurotoxic A1 reactive astrocytes, and glial scar formation. However, the present study still has some limitations. For example, the underlying molecular mechanism through which MSCs+EA combination therapy inhibits the inflammatory response is unclear. Moreover, the sample size in the in vivo study was not sufficient. The interaction between the microglia and astrocytes will be explored in vitro in the future.
CONCLUSION
Our past and present research provides unequivocal evidence that the combined MSCs+EA treatment can efficiently modulate the postinjury environment and facilitate neuronal axon regeneration and the recovery of neural function after SCI [14,15]. Another major finding of this study is that the combined MSCs+ EA treatment can reduce the polarization of the anti-inflammatory/prorepair M2 phenotype of microglia/macrophages. This was associated with the downregulation of proinflammatory cytokines and the upregulation of the anti-inflammatory factor IL-10. Alterations in the production of critical cytokines by activated microglia/macrophages and their polarization toward the M2 phenotype attenuated neurotoxic A1 astrocytes, reactive astrogliosis, and glial scar formation by modulating the ErbB1-STAT3 pathway. In other words, the combination of MSCs with EA treatment can regulate the subpopulation of microglia/macrophages and reactive astrocytes to attenuate inflammation. It can alleviate neurotoxic A1 astrocytes, excessive astrogliosis, and glial scar formation by downregulating the ErbB1-STAT3 signal pathway, thus providing a favorable microenvironment conducive for axonal regeneration after SCI. Our results provide strong evidence that the MSCs+EA treatment can serve as a promising therapeutic strategy for SCI, with the excellent potential of being translated form basic science to the clinical setting.


")