

INTRODUCTION
Nowadays, osteoporosis-related vertebral compression fractures have important health consequence particularly for older patients, including morbidity and increased mortality5). While the diagnosis can be suspected from history and physical examination, plain radiography, computed tomography and bone scanning, however, since the mid-1980s, magnetic resonance imaging (MRI) has become an instrument of choice for imaging the spinal disease1,17). In general, MRI features suggestive of acute osteoporotic compression fractures were low signal intensity band on T1-weighted image (T1WI) and spared normal marrow signal intensity on T2-weighted image (T2WI)10). Although these images have high sensitivity and specificity, the fat suppression technique gives more clear delineation of this abnormalities. Accordingly, we re-evaluated the sensitivity and specificity of the T2-Spectral Adiabatic Inversion Recovery (SPAIR) image for the imaging diagnosis of osteoporotic compression fractures in our cases. For additional information about the osteoporotic compression fractures, we evaluate the fracture lines, fluid sign and adjacent discs change on the MRI
MATERIALS AND METHODS
Retrospectively, this study included 85 patients who had been diagnosed with acute osteoporotic compression fractures and admitted to our neurosurgical department with recent back pain from January 2010 to April 2012. Almost all patients complained of back pain and/or radicular pain within 2 months after trivial events, such as lifting something, slipping down and falling from standing height, or even spontaneously. According to Dennis et al.4), the acute compression fracture was defined within 10 weeks after event. They all had underwent magnetic resonance image (MRI, Philips 1.5-tesla X-series) and bone mass density (BMD, Lunar Prodigy advance 3rd generation) for the diagnosis of acute osteoporotic compression fractures. Essentially, MRI scan included T1WI, T2WI and T2-SPAIR images. We evaluated the signal changes, fluid sign, fracture lines and adjacent discs change of the fracture segments by two neurosurgeons under the direction of one musculoskeletal radiologist. Fluid sign was defined as a focal, linear, or triangular area of strong hyperintensity on SPAIR images on a background of diffuse hyperintensity in the vertebral body because of acute collapse2).
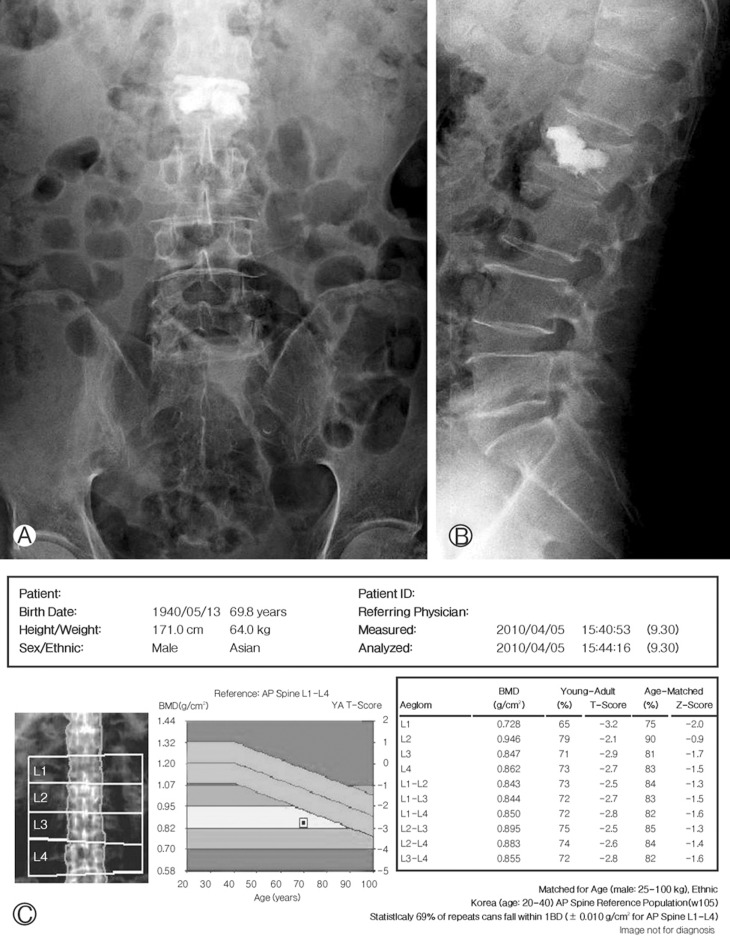
Exclusion criteria were mentioned as below; any metastatic tumors, plasmacytomas, multiple myelomas, primary bone tumors, infectious diseases, old compression fractures or Kummel's diseases. Statistical analysis was evaluated by using the SPSS v12.0 and statistical significance was assumed at a P value below 0.05. In selected cases, we performed the vertebro- or kyphoplasty for pain relief (Fig. 1).
RESULTS
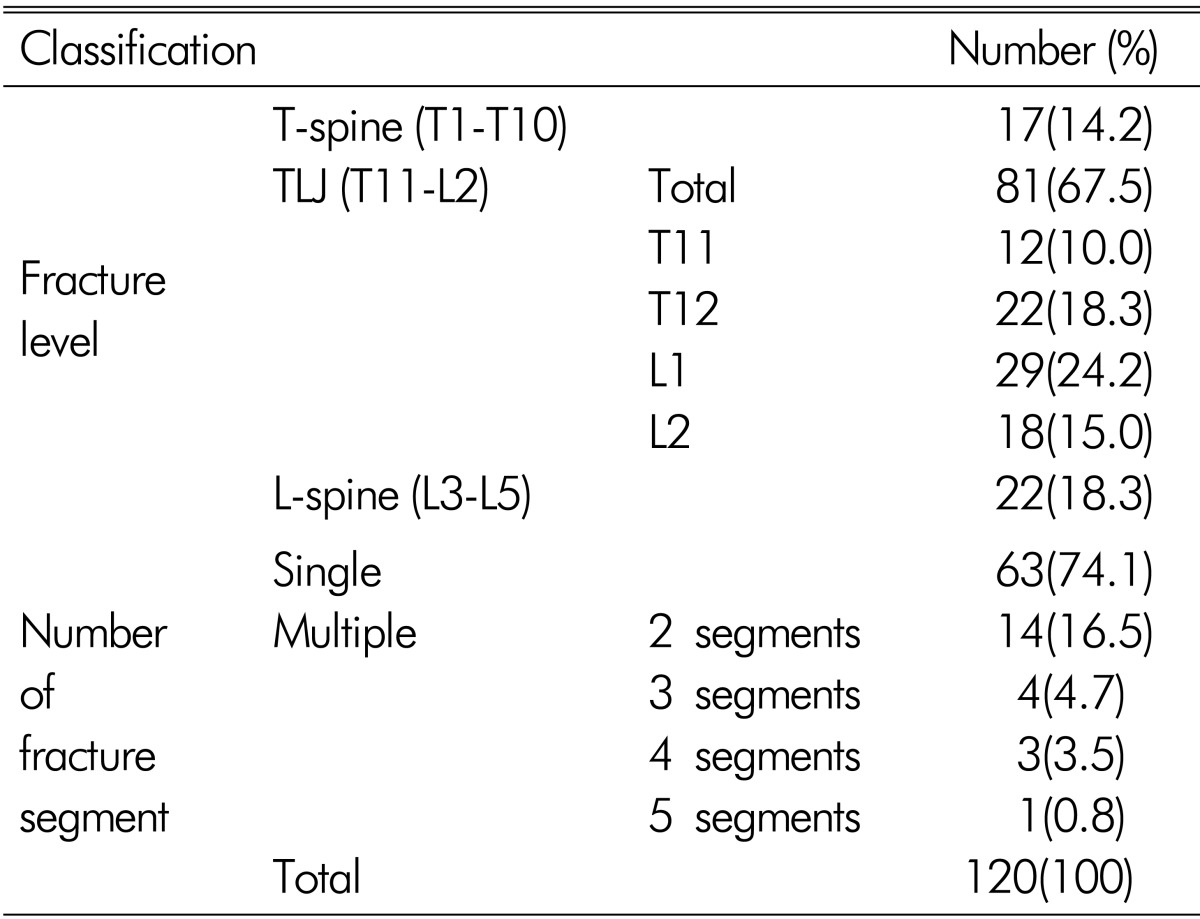
Of the total 85 patients, there were 16 males (18.9%) and 69 females (81.1%). Total 120 fracture segments were inspected. The mean age of the patients was 77.8┬▒7.2 years old at diagnosis. There were total 120 fracture segments of the 85 patients. The most common fracture level was the thoracolumbar junction (81 segments, 67.5%). There were 63 single fracture segments (74.1%) and 57 multiple fracture segments (25.9%), even five segments in a patient (Table 1).
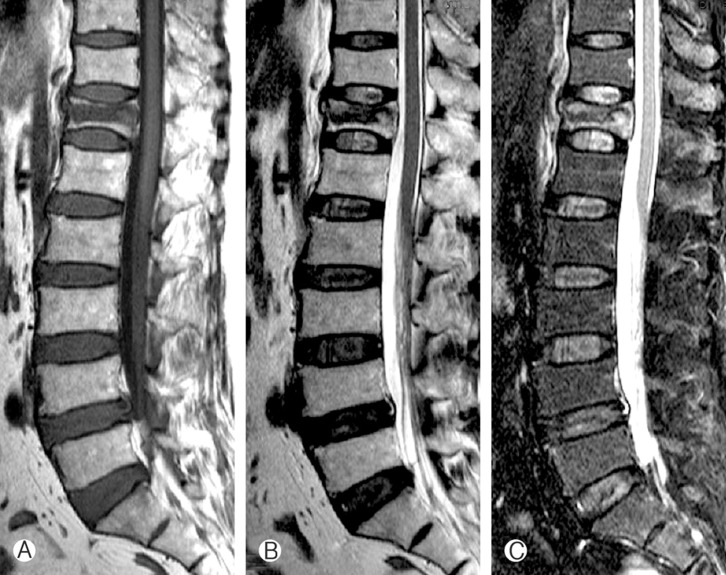
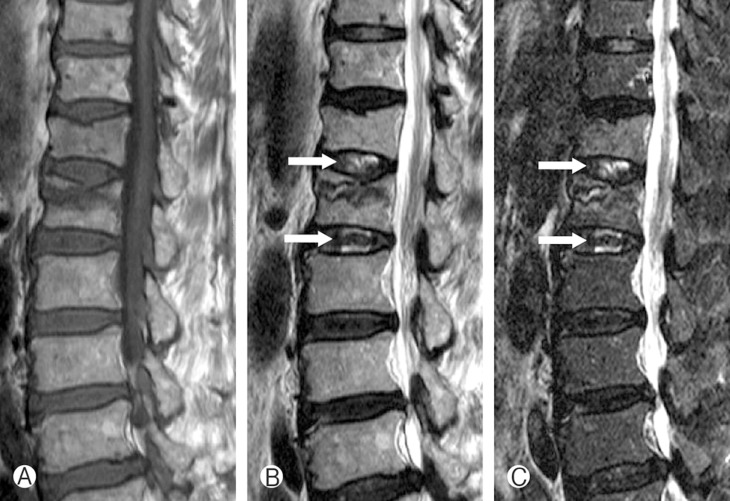
Typical MRI was demonstrated (Fig. 2) and signal intensity patterns on MRI of osteoporotic compression fracture summarized in Table 2. Notably, the incidence of "high signal intensity on T2-SPAIR image" was very high in this study (0.9917). The incidence of "low intensity" on T1WI and "essentially iso-signal intensity" on T2WI were also high (Table 2). However, they did not reached within 95% confidence interval from 0.9476 to 0.9996 of "the high signal intensity" on T2-SPAIR images, which means "high signal intensity on T2-SPAIR image" is more valuable than "low intensity" on T1WI and "essentially iso-signal intensity" on T2WI.
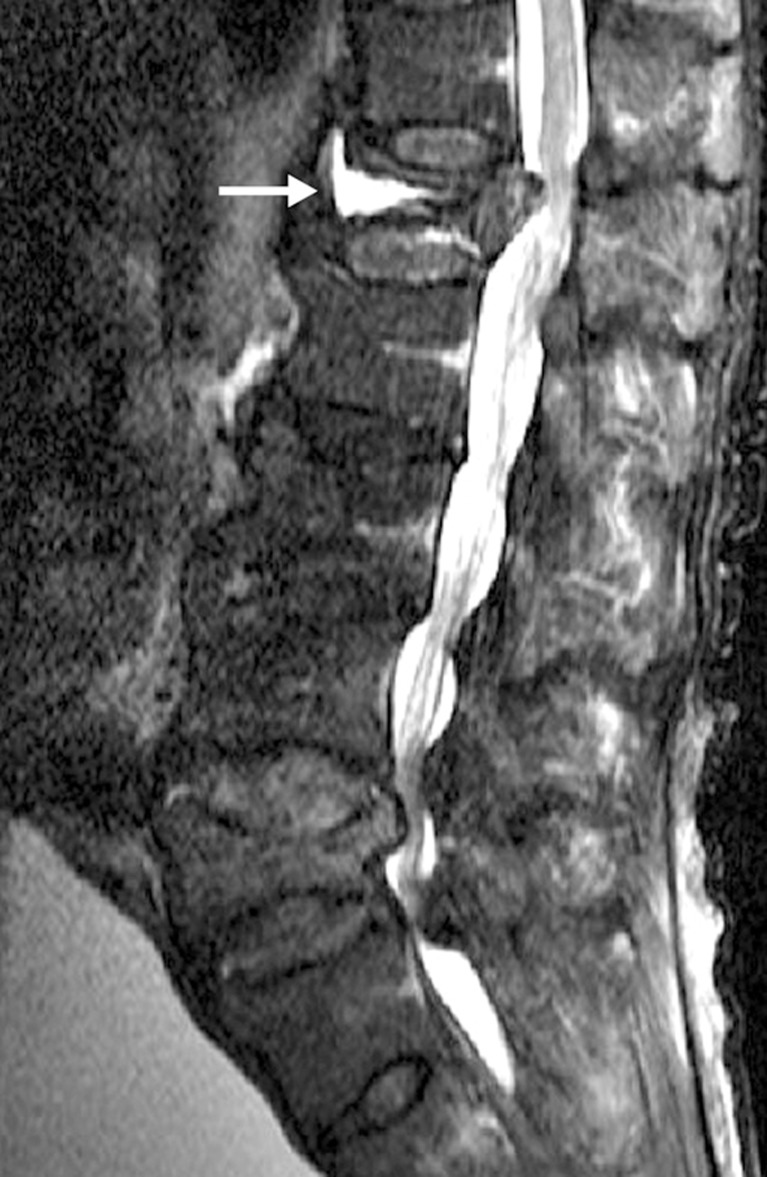
The fluid sign2) on T2-SPAIR image was observed in 56% of the acute osteoporotic compression fractures in this study (Fig 3).
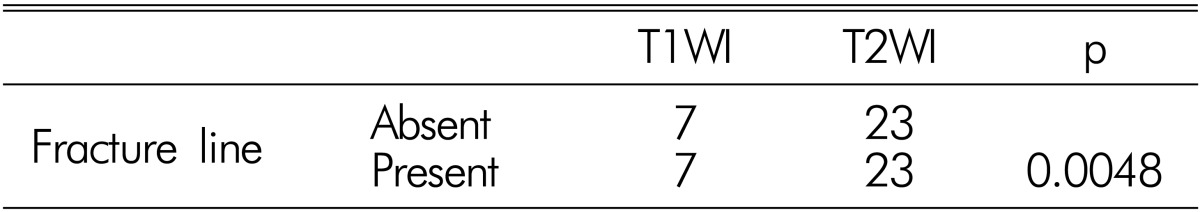
We evaluated the fracture lines according to the sequences (T1W, T2W, T2-SPAIR images) of MRI (Table 2, 3, Fig. 4). Using chi-square test, observed incidence of fracture lines between T1WI and T2WI was calculated and revealed difference with statistical significance (p=0.0048) (Table 3). The fracture lines were more observed on T2WI than T1WI by Z-test (one-tailed test, p=0.0062).
Another interesting finding was the abnormal signal intensities of the adjacent discs on MRI in the acute osteoporotic compression fractures (Table 4). Using chi-square test, the incidence was significantly different among them(p<0.0001). The observed incidence through Z-test (pairwise) revealed that "high signal change" on T2WI occurred more frequently than "low signal change" on T1WI (p<0.0001). "High signal intensity" on T2-SPAIR image is more frequent than "low signal change" on T1WI (p<0.0001). However, there was no difference between T2WI and T2-SPAIR image (p=0.0635).
DISCUSSION
As the population ages, senile disorders are markedly increasing in this community. According to the National Health Statistics in 20088), the prevalence rate of osteoporosis over 65 years old people was 51.4┬▒3.2% in female and 9.1┬▒2.0% in male, and overall 34.0┬▒2.3%14). Recently, domestic researchers reported that osteoporotic compression fracture occurred about 75,000 cases per year and one year mortality was 3.6%16) and primary osteoporosis is responsible for about 85% of vertebral compression fractures18). Therefore, osteoporotic compression fractures now come into the picture as days go by. Obviously, this osteoporotic compression fracture is predominant in the female because of estrogen defect after menopause bringing osteolysis, and finally decreasing bone mass6). The number of female patients was more than four times of male patients in this study (Table 1). In general, the most common fracture level is thoracolumbar junction (from T11 to L2) because the region forms a transition zone between the relatively fixed, kyphotic thoracic spine above, and the relatively mobile, lordotic lumbar spine below, which causes stress forces to concentrate upon the thoracolumbar junction20). The number of thoracolumbar junction fractures was more than four times of the other levels in this study (Table 1).
In general, acute vertebral compression fractures (shorter than 10 weeks old) produce "a low signal intensity" on T1WI and "high signal intensity" on T2WI because of edema, inflammatory infiltrates, bone necrosis, and disruption of fatty marrow8) (Fig. 2). In detail, on T1WI, acute osteoporotic compression fractures characteristically show "a focal band-like area of low signal intensity adjacent to the fractured endplate"7,8,12,13) and "at least one area of normal signal intensity" is seen within the collapsed vertebra, and it means preservation of marrow that contrasts to the diffuse malignant fracture. These areas of normal signal intensity are usually located opposite the fractured endplate. Increased signal intensity on T1WI may occur in a small number of benign fractures, but is not always associated with malignant fractures21). This is believed to be caused by fatty replacement of marrow cells in the degenerative disease or compaction of the marrow in benign processes19).
On T2WI, edema or disruption makes it to "high signal intensity" and a collapsed segment is "essentially iso-intense" with adjacent non-collapsed segment3,7). In this study, these findings on T1WI and T2WI were all high, which was similar to that of the acknowledged fact in broad outline (Table 2). In this study high signal intensity shown on T2-SPAIR image presented in 99.17%. However, "abnormal signal intensities" on T1WI and T2WI and "essentially iso-signal intensity" on T2WI did not reached within 95% confidence interval from 0.9476 to 0.9996 of "the high signal intensity" on T2-SPAIR images. Therefore, this result came to a conclusion that T2-SPAIR image is the most specific mode compared with T1WI and T2WI to detect the signal changes of the acute osteoporotic compression fracture (Table 2).
The presence of focal, linear or triangular areas of high signal intensity ("fluid sign") (Fig. 3)2) adjacent to vertebral end-plate on SPAIR images is said to be a feature of acute osteoporotic compression fractures2,13) and is rarely seen in metastatic fractures2,15). This fluid sign means bone marrow edema exhibiting iso-intense signal to that of cerebrospinal fluid2). Baur A. et al.2) reported that "fluid sign" was seen in 40% of osteoporotic benign compression fractures and 6% with malignant fractures. ME Abdel-Wanis et al.10) reported that "fluid sign" was demonstrated in 35% in the osteoporotic compression fractures, 2% in the malignant fractures and no in the infective fractures.
In our study, the incidence of "fluid sign" was observed in 56.7% in the acute osteoporotic compression fractures (68 of the total 120 segments) on T2-SPAIR image. There are some differences of the incidence of this "fluid sign" according to the authors. Our cases were about four times more than ME Abdel-Wanis et al. This "fluid sign" is one of the suggestive findings of the acute osteoporotic compression fractures when considered the above studies2,10,13,15). At the moment, we are studying this finding compared with malignant fractures.
On the other hand, a linear area of low signal intensity corresponding to the fracture line or trabecular impaction can be seen on T2WI and/or T1WI (Fig. 4)13,15). In this study, the observed incidence of fracture line or trabecular impaction on T2WI was higher than T1WI (Table 3) (p=0.0062). We thought T2WI is more helpful than T1WI to detect the location of fracture and vector of traumatic force.
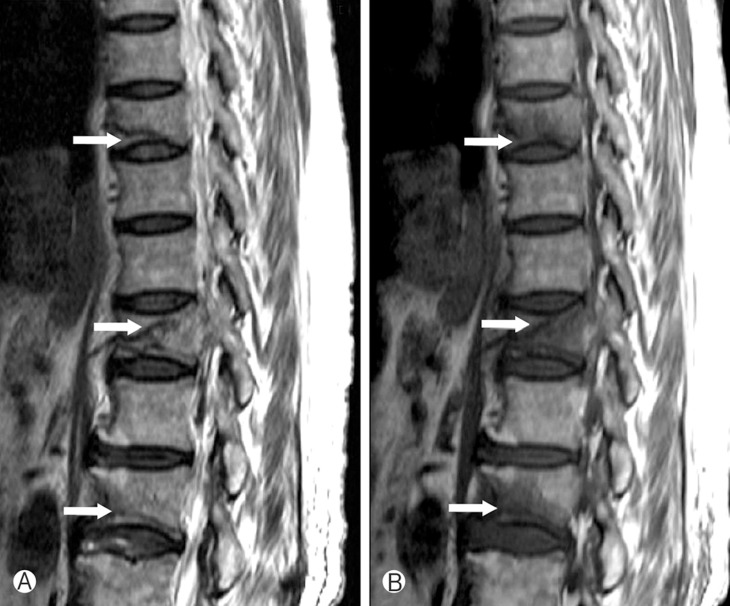
Disc involvement is seen frequently in traumatic benign compression fracture21). This signal change of adjacent disc is thought that it is caused by change of biochemical and histological composition of the annulus and nucleus pulposus followed by alteration of pressure profile due to fracture of vertebra9,11). Furthermore, depression of the fractured endplate alters the pressure profile of the damaged disc resulting in increased compressive loading of the anterior wall of adjacent vertebra that predisposes it to wedge fracture11). However, its incidence is rarely reported until now. We investigated abnormal signal intensity patterns of the adjacent discs manifested as "hypointense" on T1WI and "hyperintense" on T2WI and T2-SPAIR image in the acute osteoporotic compression fractures. Adjacent discs mean the above and below discs of the osteoporotic compression fracture segment compared with other discs of the non-fractured segments (Fig. 5). Incidence of signal changes were 7.5% on T1WI, 63.3% on T2WI and 73.3% on T2-SPAIR images (from 3.7 to 14.2 on T1WI, from 54.0 to 71.8 on T2WI, and from 64.4 to 80.8% on T2-SPAIR image in 95% confidence interval) (Table 4). Statistically, the observed abnormal signal change on T2WI and T2-SPAIR image occurred more frequently than T1WI (p< 0.0001, p<0.0001, each other). However, there was no difference between T2WI and T2-SPAIR image (p=0.0635).
On the contrary, some authors reported that disc involvement was found in the infective fractures (97%) and malignant fractures (2%). There was no disc involvement in the osteoporotic fracture cases on the T1WI and T2WI10). However, the SPAIR image was omitted in their series. We are planning to compare the osteoporotic fractures with infective and malignant fractures according to the all modes of MRI.
CONCLUSION
T2-SPAIR image is the most specific compared with T1WI and T2WI to diagnosis the acute osteoporotic compression fracture of the all sequences (99.17%, from 0.9476 to 0.9996 with 95% confidence interval).
The fluid sign on T2-SPAIR image was observed in 56.7% of the acute osteoporotic compression fractures in this study and it is supplementary suggestive findings of the acute osteoporotic compression fractures. Accordingly, T2-SPAIR image is very useful and gives more information to detect the acute osteoporotic compression fractures.
T2WI is the more useful mode to detect the fracture line or trabeculation in the acute osteoporotic compression fracture than T1WI (p=0.0062). We suppose T2WI is helpful to detect the location of fracture and vector of the traumatic force.
The incidence of abnormal signal intensity on the adjacent discs was high on the T2WI (63.33%) and T2-SPAIR image (73.33%) in this study. Accordingly, this abnormal signal intensity on the adjacent discs may provide additional information on the acute osteoporotic compression fractures.


")